
Information and Communication Technology is necessary to help organisations, as well as grassroots collectives to better communicate, plan, organise, implement, monitor, and develop programmes and initiatives.
This guidebook strives to fulfill the preliminary needs of different small to medium CSOs in better using technology in their daily tasks. It targets team members fulfilling different roles in an organisation, and assumes the team has basic digital literacy.
This guidebook covers the use of MS Office, working on the Google Suite, Monitoring & Evaluation using Google Forms or KoboToolkit, and creating basic websites using Wordpress which is particularly useful for communication staff.
This guide refers to various tutorials selected from several sources, these annexes can be found on Lebanon Support’s Civil Society Incubator website, and are available for download here. Careful consideration was taken to also include external links for further support and learning.
This guidebook was developed as part of “Ta’cir - Towards an Active Participation of Civil Society in The Reform Process” implemented by ACTED in partnership with Lebanon Support, Akkarouna, and Sheild, and funded by the European Union. It is published as part of the Civil Society Incubator, a programme by Lebanon Support.

Introduction
Information and Communication Technology is necessary to help organisations, as well as grassroots collectives to better communicate, plan, organise, implement, monitor, and develop programmes and initiatives. This guidebook strives to fulfill the preliminary needs of different small to medium CSOs in better using technology in their daily tasks. It targets team members fulfilling different roles in an organisation, and assumes the team has basic digital literacy. This guidebook covers the use of MS Office, working on the Google Suite, Monitoring & Evaluation using Google Forms or KoboToolkit, and creating basic websites using Wordpress which is particularly useful for communication staff.This guide refers to various tutorials selected from several sources, these annexes can be found on Lebanon Support’s Civil Society Incubator website. Careful consideration was taken to also include external links for further support and learning.
Microsoft Office
Personal computers (PC) allow us to create well-structured and formatted text documents, highly functional and automated spreadsheets, as well as attractive and visually pleasant presentations. These three important functionalities are now considered among the basic operations that a PC can carry out and are also available on smartphones.
Mostly, the software performing these tasks are bundled in one suite (composed of different applications that share a similar line of work) which is often called “Office suites”. The standard package of a contemporary office suite includes:
-
A word processor (i.e. MS word, LibreOffice word, Google Docs, etc.)
-
A spreadsheet processor (i.e. MS excel, LibreOffice spreadsheets, Google Sheets, etc.)
-
A presentation processor (i.e. MS PowerPoint, LibreOffice draw, Google presentation, etc.)
While Microsoft Office is the most widely used office suite, it is not the only one. Open source, free alternatives, like Openoffice.org (owned by Apache®) and libreoffice.org, do exist. These two office suites are downloadable, usable, and shareable for free.
With the advancement of the Internet infrastructure globally, cloud office suites have emerged. These are usually proprietary, although many of them are free and only require the creation of a free account to access their basic services (i.e. GSuite). Some of them, like the mostly known MS office, can seamlessly edit your documents online and offline (i.e. MS office 365 package) by giving you a space on a cloud storage account to save your documents to (i.e. MS OneDrive, Google Drive …).
This section, along with its annexes found on the Civil Society Incubator website, will introduce intermediate level skills for software included in MS Office’s standard package, namely: MS Word, MS Excel, and MS PowerPoint. Their functionalities and abilities, covered in this guidebook, are similar to other softwares from other distributors.Before we proceed, international organisations such as TechSoup, offer important discounts to nonprofits for the purchase of MS Office as well as other softwares.
What is TechSoup?
Target group: all staff. Level: beginner
TechSoup is a channel through which different software and tech companies donate licenses to non-profits. Any organisation wishing to benefit from these discounts needs to apply to TechSoup and go through the vetting process.
To start , if you are an organisation registered in Lebanon, Go to http://lebanon.techsoup.global and click on the link to join the network (إنضم الآن). Have the below ready:
-
A copy of your registration ( علم وخبر) ready to be uploaded as PDF
-
A copy of your organisation’s internal rules and regulations (النظام الداخلي)
-
Your website and Facebook page
-
Your organisation’s current yearly budget
Then follow the registration process.
How to use Microsoft Word to publish a document?
Target group: all staff. Level: Intermediate
Introduction
The following section details how to create, organise, design, and publish a document on Microsoft Word.
Let’s try to write an annual report narrative together. For the purpose of this exercise, we will consider that we are part of an organisation called Freedom of Information Organization in Lebanon, or FIOL, and that this organisation’s mission is to promote universal access to information across Lebanon, protect cyber rights, and act as a watchdog for corruption and rights infringement in the ICT sector. It is a small organisation with 13 employees in total. Sara, the project officer is compiling last year’s narrative report from several sources sent to her by different employees in the organisation. Once done, Sara will share the document with 2 colleagues: Rola from communications, to adhere to visibility standards, and Lina, the director of the organisation.
Throughout this section we are going to learn about:
-
Styles
-
Layout (Sections, Chapters, breaks …)
-
Tables
-
Charts
-
Review, track changes, comments
-
Mail Merge
It is important to note again that this guidebook assumes that the trainee has basic MS Office Skills, and knows how to create MS Word documents. Annex 01A contains a quick overview of MS Word 2016’s interface, downloaded from Microsoft’s website.
To start, Sara has received 4 different documents:
-
Narrative report of the activities for the Cyber Rights programme
-
Narrative report of the activities for the Internet Infrastructure Mapping project
-
Narrative report of the activities for the ICT Watchdog programme
-
An Excel file with some M&E indicators from all 3 programmes
For the purpose of this guidebook, we will assume each document contains information as follows:
-
Title, date, narrative paragraph, and a picture
-
The excel has 3 sheets, each one with a calculation leading to one indicator
Sara will also include in the report some information about the organisation and its programmes.
Cover page:

The first page of the report is essential. It should capture the reader’s attention and should provide a very brief abstract about the report. By going to the Insert tab and choosing Cover Page, MS Word provides Sara with a gallery of cover pages templates. Sara can also customize a cover page template by selecting all contents on this page and saving it by clicking on Cover Page > Save selection to Cover Page Gallery. This will enable her to use this cover page template in other documents, as well. (For a tutorial on how to create cover pages, refer to Annex 01B.)
Content:
-
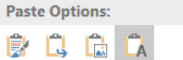
Sara needs to copy and paste the content from different documents and the best way to do so without disrupting the document styling flow is by right clicking and choosing Paste Options > Use Text Only. This is needed as she will style the whole document once she places the content.
-
It is best to place content in the following order: Title, Subtitle, Text, Pictures. This structure is easy for MS Word to understand and will enable Sara to easily implement the Table of Content feature. She can later change the placement of the pictures, or any other sectioned off content, as she sees fit in accordance with the formatting she will apply. It is very important to caption pictures, explaining their context as this adds to the credibility and professionalism of the content. This can be done by right-clicking on the picture and choosing Insert Caption.
Styles:
MS Word offers built in styles for use. Sara can easily select headings and choose Heading Styles accordingly. She can also create new styles by simply modifying the text as she wants, selecting the Create Style from the dropdown menu in the style bar. Furthermore, she can change paragraph styles and other elements using Modify when she right-clicks on a style. (For more on paragraph styles, refer to Annex 01C.)
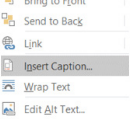
Table of Contents:
-
After styling the headings, text, and paragraphs, Sara can use the automatic Table of Contents (TOC) creator, by going to the References tab and clicking on Table of Contents (see Annex 01C.)
-
The table of contents itself can be formatted.
-
If any changes happen later to the content and sections, she can go back to the TOC and click on update Table. However, this will reset any formatting for the TOC.
Breaks and Section breaks:
-
To begin with, Sara can control how her document looks. A single document can have several different sections, and each section, for example, can have its own header and footer, orientation, formatting, and spacing (see Annex 01D).
-
Sara can use sections to make other formatting changes on the same page or on different pages in your document, including:
-
Change page orientation, by choosing Orientation from the Layout tab
-
Add a header or footer (see Headers and Footers)
-
Add page numbering (see Headers and Footers)
-
Add columns by choosing Columns in the Layout tab
-
Add page borders by choosing Page Borders in the Design tab
-
Headers and Footers:
-
The header is a section of the document that appears in the top margin, while the footer is a section of the document that appears in the bottom margin. Headers and footers generally contain additional information such as page numbers, dates, an author's name, and footnotes, which can help keep longer documents organised and make them easier to read. Headers and footers also often have branding elements, like logos, which are inserted the same way any image is inserted in MS Word. Anything entered in the header or footer will appear on each page of the section, or the whole document in the case where it is not partitioned into sections (see Annex 01E).
-
Sara can create a header by going to the Insert tab in the toolbar, clicking on Header and choosing a template. The text in the header can be customised accordingly.
-
Similarly, footers can be inserted. The footer can also contain page numbers. By choosing the location on the footer, and clicking on Page Number from the Insert tab, the document pages will be numbered, with the ability to customize the placement and text formatting. Numbers can also be continuous from previous sections or reset in new sections. This can be done by selecting page number > Insert Tab > Page # > Format page number.
-
Tables:
-
Tables are a very handy way to lay information out in a clear and professional way. Tables are composed of:
-
Cells: the smallest unit where information can be inserted
-
Columns: the vertical grouping of cells
-
Rows: the horizontal grouping of cells
-
-
In our example, Sara will copy data from MS Excel and paste it into the report. The data will be normally pasted as a table. She can also insert new tables by going to the Insert tab and choosing table. There she needs to define how many columns (vertically) and rows (horizontally) she needs in her table. If she uses up all her rows, she will be able to add an additional row by placing the cursor in the last cell of the table (located in the bottom-right) and pressing the Tab key. There are also shortcuts to add columns and rows which appear as a + (plus sign) when she hovers over the top border of any column or the left border of any row.
-
Tables have borders, which can be formatted and customized down to the cell granularity. i.e. Sara can choose different borders for the whole table, specific columns, specific rows or even specific cells. In fact, in HTML, the code language used to build websites, tables are used to lay the pages out. A very handy feature is to create tables and set their borders to Zero (0). The table will then not show any borders, while still laying out the information in a grid. Similarly to pictures, tables can also be captioned by Right Clicking > Insert Caption.
-
Existing text can also be converted to a table in Word 2016 if rightly formatted (see Annex 01F) for a tutorial on creating and formatting tables.
-
Quick tables are another handy feature which can be accessed by going to the Insert tab > Tables > Quick Tables. These are ready-made, formatted and designed templates of different tables like calendars, matrices, lists, etc.
-
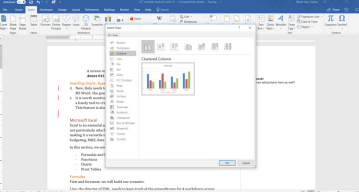
Charts:
-
Now that Sara inserted the indicators into the document as a table, she can draw a chart out of this data. Charts or graphs are a visual graphic that summarises information or data.
-
Charts can be either built-in Excel and copied/pasted into the document or created in Word.
-
Word offers several types of charts to represent data. Sara can choose among these the most suitable type of charts depending on the nature of the data that she wants to represent.
-
To insert a chart, Sara can go to the Insert tab >Chart. She can then choose the chart type and press OK. Word will then prompt a spreadsheet, where the data can be either inputted or copied and pasted from an excel sheet.
-
Charts have several elements that can be customised, such as the colour scheme, legend and title (see Annex 01G for a tutorial).
-
Track Changes:
Now that the report’s first draft is done, Sara needs to gather feedback from Rola, the Communications Officer and Lina, the Director of the Organisation. MS Word, much like other word processors, offers a very useful functionality called Track Changes. Basically, it is like passing a printed document by several people, with each person commenting or editing the information on the document in a different colour. This enables Rola and Lina to give feedback directly on the document by either directly changing the content or inserting comments. The software records each change and comment and can show the person who performed this change. To make sure that each change is labeled by its author, the Name and Initial settings should be set in MS Word. This can be done by going to File > Options > General and typing the name of the user and their initials in the Personalize your copy of Microsoft Word section. MS Word also offers the possibility to accept or reject the changes.
-
To activate track changes, Sara goes to Review > Track Changes. She can then save the document and send it to Lina, the Director, by email.
-
Lina can edit the document and insert comments, and then sends it to Rola, the Communications Officer.
-
To view all of Lina’s changes, Rola makes sure that the All Markup option is chosen in the Review tab next to Track Changes. The different options in this menu are:
-
Simple Markup: This shows the final version without the inline markups (i.e. markups appearing in the text itself). Instead, red markers will appear in the left margin to indicate where a change has been made.
-
All Markup: This shows the final version with inline markups.
-
No Markup: This shows the final version and hides all markups.
-
Original: This shows the original version and hides all markups.
-
-
Rola can also click on Show Markup > Reviewing Pane to activate a side pane that shows all the changes made in the document.
-
Sara can also choose to accept all changes at once by choosing Accept all changes, she can also do so and stop tracking by choosing Accept all changes and stop tracking. Both options are accessible from Review tab > Accept menu.
-
Sometimes, a comment is sufficient instead of editing the content. While both features can be used together, it is not necessary to have track changes activated to use comments. Comments can be inserted by going to the Review tab > New Comment. They can be navigated by using the Previous and Next buttons, deleted by using the Delete button or they can be hidden or shown with the Show Comments button. On each comment, one can either use the Resolve button, which indicates that the comment was taken into consideration, or the Reply button, which gives the ability to write a reply under the comment(see Annex 01H for a tutorial).
Mail Merge:
After finishing up the report, Sara needs to send it to several people. Instead of writing up an email for each person, she can use the Mail Merge feature. Mail Merge enables Sara to perform operations on documents in bulk. This can either be print letters, envelopes or send emails with customized content for each one printed or sent (different Dear Mr. or Mrs for each letter with different names). Sara will now send an email using Mail Merge. Although she cannot attach the file in this feature, however, she can either upload it to the organisation’s website or to Google Drive and include the link in the bulk email. This is also a smart move to track who downloaded the file using google analytics or similar products.
-
To send the bulk email, Sara writes up the content in MS Word, while leaving fields to be customized blank. These fields can be the Title of the person who will receive the email, their name, organisation, etc...
-
Mail merge can also create, in bulk, letters to be printed either as hard copies or PDF, printed envelopes, labels, etc..
-
The list of the addresses and information about the people that the email is being sent to can be either inputted in Word or it can be an Excel file.
-
To start Mail Merge, Sara can go to Mailings > Start Mail Merge > Messages.
-
To load the information that needs to be customized in the letter, she can click on Select Recipients menu. Here she can either choose to input the information of the recipients directly by choosing Type a New List or use an existing Excel sheet by choosing Use an Existing List. Note that if she is typing a new list, after finishing the list she needs to save it on her computer.
-
Sara then places the cursor exactly where she wants the first piece of information inserted from the list, and clicks on Insert Merge Field from the Mailing tab.
-
Once done from the customization, Sara can preview the results by clicking on Preview Results in the Mailings tab, and then she can choose Finish & Merge. This menu provides the possibility to edit individual documents, print the documents or send the emails. Once the Send Email Messages is chosen, MS Outlook would open and queue in the email messages(see Annex 01I for a tutorial).
Building Presentation On Microsoft PowerPoint
Target group: all staff. Level: Intermediate
Microsoft PowerPoint is a powerful tool to build presentations. While there are many presentation software and services out there (LibreOffice Draw, Prezzi.com, SlideShare), PowerPoint remains the tool that is mostly used.
Let us start with a scenario:
Rola, the communications officer in FIOL is building a presentation to showcase the activities of the Cyber-Rights programme. She has a 30 seconds video of a workshop, some pictures of different activities, and some indicators and impact of the programme.
She will follow this structure for the presentation:
-
Introduction to the organisation
-
Introduction to the programme
-
Pictures from different activities
-
The 30 seconds video from the workshop
-
Charts built from indicators of the programme
All this information exists in the Narrative Report that Sara previously built using MS Word, with the video being an exception.
To do so, she will need the options of theming, Slide Master View, Inserting videos and audio, and inserting charts, diagrams and hyperlinks in MS PowerPoint.
Rola prepares the content she needs by copying it and pasting it to a new word document. In the same folder, she places the video, and any additional images she would need.
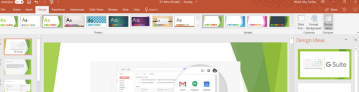
Theming
-
A theme is a set of predefined colors, fonts, and layout. In PowerPoint, the layout is that of the slides. Theming enables Rola to apply the same style for these elements to the entire presentation in a quick and effortless way.
-
-
She can choose from a predefined gallery of themes by going to the Design tab and selecting a theme from the toolbar.
-
She can also create a new theme. This is recommended since organisations tend to use one unified visual identity for their presentations. By creating a new theme, Rola can apply it to any future presentations she needs to develop.
-
To create a new theme, she needs to define custom Colors, Fonts, and Background Styles.
-
To customize colors, she goes to the Design tab, clicks on the drop-down arrow in the Variants group, chooses Colors and then clicks on Customize Colors. This will prompt a dialog box with different color elements which Rola can customize according to her organisation’s branding.
-
To customize fonts, from the Variant group, she chooses Fonts > Customize Fonts.
-
To customize background styles, she follows the same steps but chooses Background Styles from the Variant group.
-
She can now save the theme by going to the Themes drop down and choosing Save Current Theme.
-
The next time Rola needs to build a presentation, she can find the theme she built in Design tab by clicking on the drop-down arrow in the Themes group (see Annex 01J for the tutorial on customising themes).
-
Note that Rola can also customise the effects of her theme in the same way she customises fonts and colors. Effects are the way that Shapes are displayed in PowerPoint.
-
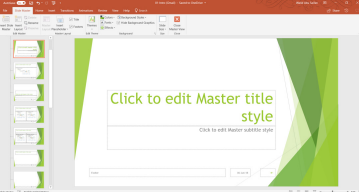
Slide Master View
-
After applying the theme to the presentation, Rola inserts a few slides and starts copying and pasting the content from the Word document she created. However, she notices that she is modifying the layout of each new slide individually, as she creates each slide, in order to suit her presentation. In order to avoid wasting time by formatting each slide individually, Rola can use Slide Master View.
-
-
Slide Master View allows Rola to modify the layout once, for all the slides in her presentation. She can change the arrangement of the text and image boxes, insert a background and add the logo of her organisation to all the slides in the presentation at once. To do so, she clicks on the View > Master Views > Slide Master
-
Now she can change the first slide as she wishes. Any changes and additions here will reflect on the existing and new slides. She can also change individual layouts, which will reflect on the existing and new slides using those specific layouts. After doing the desired modifications, she clicks on the Close Master View in the toolbar.
-
She can also insert a new layout while in the Slide Master View by going the Slide Master tab and clicking on Insert Layout (see Annex 01K for the tutorial).
Inserting Videos, Audios, and Images:
-
Rola now needs to insert the video. The process is quite simple. She goes to the Insert tab and chooses Video > Video on my PC from the Videos group, then chooses the video. However, PowerPoint has a few tricks up its sleeves for videos.
-
Rola can actually edit the video right from powerpoint. She can trim the video, change the volume, or even add a bookmark at a certain timestamp. The bookmark will show on the video’s timeline, making her able to jump right to it by clicking on it.
-
Adding audios and images follows the same principle. It is worth mentioning that one can also insert screenshots of opened windows by using Insert > Screenshot. A screen recording can also be inserted using Insert > Screen Recording (check Annex 01L for the tutorial on working with videos..).
Inserting charts, hyperlinks, and diagrams
-
Now, Rola needs to insert the charts. This process is identical as inserting charts in MS Word. She goes to Insert > Chart and follows the same steps indicated in Annex 01G.
-
It is worth mentioning that she can also build a diagram by using SmartArt. This can be a handy tool to create organisational charts or to visualise a certain project’s process. This feature is also available through the Insert tab.
Basics Of Microsoft Excel For Budgeting and M&E
Target group: all staff. Level: Intermediate
Excel is an essential and indispensable tool for organisations. This spreadsheet processor boasts a plethora of features making it a versatile tool for different functional areas including but not limited to budgeting, M&E, data processing, and information interoperability.
In this section, we are going to explore the following functionalities in MS Excel:
-
Formulas and how to use them across multiple worksheets
-
Functions
-
Charts
-
Pivot Tables
Formulas
Lina, the director of FIOL, needs to keep track of the expenditures for 4 workshops happening across Lebanon. She has 6000 USD allocated for the workshops and is using excel to draft her budget and estimate the overall expenses.
She creates an excel file with 5 worksheets, one for each workshop: Beirut, Bekaa, South, North and Total.
She will now list the expenses:
-
Room rental
-
Lunch
-
Coffee Break
-
Markers
-
Pens
-
Notebooks
-
Handouts
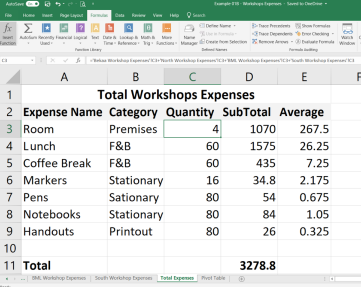
Next, she places the list in each worksheet and categorises them, adds quantity and cost, they now look like the following:
|
Expense Name |
Category |
Quantity |
Cost |
|
Room |
Premises |
1 |
250 |
|
Lunch |
F&B |
15 |
25 |
|
Coffee Break |
F&B |
15 |
7 |
|
Markers |
Stationary |
4 |
2 |
|
Pens |
Stationary |
20 |
0.5 |
|
Notebooks |
Stationary |
20 |
1 |
|
Handouts |
Printout |
20 |
0.3 |
|
Total |
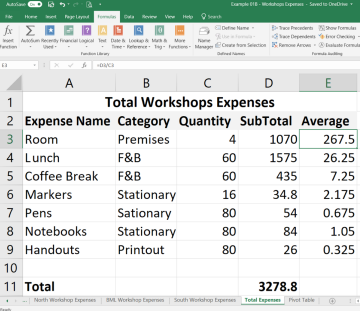
Lina does this for each sheet by copying and pasting and changing the values. You will notice that when changing values of Quantity (column C) and Cost (column D) the result in SubTotal will update accordingly. This is because Lina used a formula in the SubTotal column. Then, she copies and pastes the table in the Total sheet and removes the Cost column.
In the Total sheet, the quantity for each item will reflect the sum of all quantities in all areas for this item and the SubTotal for each item will reflect the sum of all the subtotals in all areas for this item.
She clicks on the Cell for the Cost of the Room and types = (equal sign) then navigates to each worksheet and clicks on the desired cell to be added and types + (plus sign). Notice that with each addition the formula bar is adding the cells
The final formula in the formula bar looks like the following:
=’Bekaa Workshop Expenses'!C3+'North Workshop Expenses'!C3+'BML Workshop Expenses'!C3+'South Workshop Expenses'!C3
Which basically is :
=‘Worksheet Name’!CellAddress+‘Worksheet Name’!CellAddress+‘Worksheet Name’!CellAddress+ Worksheet Name’!CellAddress
Notice that the same can be done using different Excel files, i.e. you can calculate in one file using the values of another by using the ‘[filename.xls]Worksheet Name’!CellAddress syntax.
She does the same to the SubTotals by clicking on the calculated cell and dragging the small green box to the cells below. Excel automatically replaces the references with incremented ones (!C3 becomes !C4 and so on).
Now, she needs to add a column to calculate the average she paid on each item, to do so, she simply needs to divide Subtotal by Quantity of each item, so she inserts a formula into cell F3 as follows: =E3/C3 and double-clicking on the small green box on the cell's edge.
If she changes anything in the cells that she used in her calculation (Not the cells that hold the formulas) i.e. the Quantity and Subtotal Cells in the Workshop sheets, the cells holding the formulas automatically update by redoing the calculations.
It is essential to note that Excel calculates formulas based on the following order of operations:
-
Operations enclosed in parentheses
-
Exponential calculations (3^2, for example)
-
Multiplication and division, whichever comes first
-
Addition and subtraction, whichever comes first
A mnemonic that can help to remember the order is PEMDAS.
So, given the following formula 10+(6-3)/2^2*4-1, try to figure out how excel would solve it.
(The answer should be 12). For a tutorial on Formulas, (check Annex 01M).
Functions
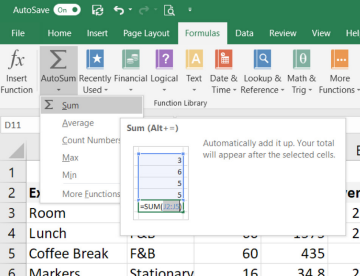
To perform operations across multiple cells, Excel offers the functions feature. In fact, Functions are one of the most powerful tools of excel.
Functions are prebuilt formulas. For instance, the Average function can calculate averages. To know what to calculate, we must specify something called Arguments for each function. An argument is a variable that will be processed within a function.
Think of it this way:
A juicer’s function is to process fruits to juice. The fruits can be grapes, apples, pears, etc Thus, function Juice can take either an apple or a grape or both to process them and the result will be the juice itself: Juice (apple, grape).
The number of Arguments a function can take depends on the function itself. For instance, the Average function can take as many arguments as we want. The way we “pass” Arguments to functions is as follows:
Average(Argument 1, Argument 2, Argument 3) and so on.
Arguments can be variables, constants, or even functions. For instance, the following:
Average(Sum(A1,A2), Sum(B1,B2)) calculates the average of cells A1+A2 and B1+B2.
Functions can also take calculations as Arguments, for example: Average(Sum(A1,A2)*2,Sum(B1,B2)/3).
With the power of nesting, or using functions inside functions, Excel becomes a super tool for different tasks.
Here are some of the most used functions:
-
SUM: This function adds all of the values of the cells in the argument.
-
AVERAGE: This function determines the average of the values included in the
argument. It calculates the sum of the cells and then divides that value by the
number of cells in the argument.
-
COUNT: This function counts the number of cells with numerical data in the
argument. This function is useful for quickly counting items in a cell range.
-
MAX: This function determines the highest cell value included in the argument.
MIN: This function determines the lowest cell value included in the argument(check Annex 01O for a tutorial about functions).
Pivot Tables
In a scenario where one can have a large amount of data, one might need to summarise this data in different contexts.
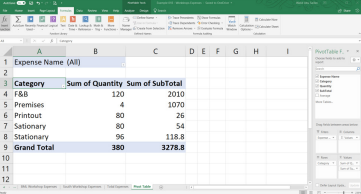
Pivot Tables can instantly calculate and summarize the data from a sheet in a tabular form.
To do so, we simply go to the Insert tab > Pivot Table (the first icon in the tab). This will create a new worksheet and open a right-side panel where we can choose the fields (columns) to add to the table. In the bottom of this panel, we have 4 boxes: Filters, Columns, Rows, Values. You can apply fields (columns) value to each as desired by dragging the field and dropping it in the intended box.
-
Filters allow you to filter data (by expense name in the figure below)
-
Columns allow you to show the property of the field that you need (often it is values like below)
-
Rows allow you to add fields you want to show the property for (like F&B below)
-
Values is the actual operation that you need to perform on Columns ( Sum in our example), it can be changed to different functions
For a tutorial about pivot tables, (check Annex 03P).
G Suite
Introduction to the Cloud
Target group: all staff. Level: Beginner
With the fast advancement of internet infrastructure which enabled huge speed increments and quota expansions, organisations started to expand and distribute their data centers and were able to offer more services at cheaper rates. Most importantly, it became much more cost effective for organisations to purchase such services instead of carrying them out internally.
Indeed, the key element to the success of cloud computing is the infrastructure. It became efficient to remotely process the data and send it back to the user. For example, Alia is working on Adobe’s cloud suite, she needs to create a poster using Illustrator. Alia has 2 choices:
-
Use Adobe Illustrator on her computer, this requires:
-
Having a powerful computer
-
Buying a license for Adobe Illustrator
-
Maintaining the computer’s hardware and software
-
Managing backups for the data
-
Use Adobe Illustrator on Adobe’s cloud suite, which requires:
-
Paying for a monthly subscription per user
-
Uploading the material that Alia needs to work with
In option 2, Alia is actually using the computing power of the server where the suite is located.
-
She does not need a powerful machine locally
-
She does not need to worry about backups as his files are stored on the cloud
-
She does not need to worry about an IT person maintaining her PC and upgrading it from time to time
-
She actually can access Illustrator and his files from ANY COMPUTER in case her machine stopped working or was inaccessible
So, what is the cloud?
Physically:
The cloud is made of data centers. Data centers are facilities that hold arrays of special cabinets which in turn, hold rows of servers (i.e. powerful computers to serve many people at once for specific functions). The cabinets and facilities are specially designed for optimal performance of servers, providing them with adequate electricity, ventilation, and connectivity.


Logically:
Above the physical layer, the cloud is a huge matrix of servers that are interconnected, with each doing a specific function (Data storage, mail, DNS, antivirus, application, etc.…). All these servers can talk to each other, coordinate, and exchange services. In the near to intermediate future, most of the computing power will be used on the cloud. Most people will own laptops or devices that do not need powerful specifications, as most of the work would be done on the servers and the results sent back to us, the users.
An office in the cloud
Target group: all staff. Level: Beginner
There are several office suites which operate entirely on the cloud, i.e. they can be accessed like any website and run entirely on the server, or else, the suite has a mixed model with an offline software component (such as MS office). Noting that MS office has a fully-fledged cloud suite called Office 365, in this guidebook we are going to use G Suite, as the leading cloud office suite. As usual, the functionalities are common and similar across different services. For up-to-date tutorials on G Suite check the Gsuite Learning Centre: https://gsuite.google.com/learning-center.
We are going to explore the following apps:
-
Gmail
-
Google Calendar
-
Google Docs
-
Google Sheets
-
Google Slides
-
Google Forms
-
Introduction to Hangouts and meet
-
G Suite:
In 2006, Google introduced “Google Apps for Your Domain.” Organisations were able to use their own domain (i.e. lebanon-support.org, unesco.org, etc …) to host email services as well as a storage drive and office suite. The organisation could also customize the theme (colors and icons) of the interface and feature their own logo, while the user’s experience and interface remain the same for any Gmail or Gsuite account, with a free quota of 15GB , and a premium Gsuite starting 30GB per user for its Basic 5USD/user/month plan. To learn more about this, visit Google’s learning platform ( https://gsuite.google.com/intl/en/pricing.html?tab_activeEl=tabset-companies ).
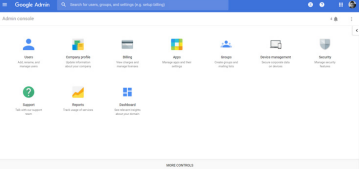
First, your ICT professional has to set the domain up to use G Suite. Afterward, the organisation’s account will have a designated administrator who can access the Dashboard to create new users and perform different operations. Once the account is set up, Google offers a very good wizard with a very easy learning curve which does not require an ICT professional expertise as any other staff member with good ICT knowledge can administer the account.
Figure 1 GSuite Administration Dashboard
This guidebook’s scope does not cover Gsuite administration, however, the usual steps are:
-
Create a user (Ex: john@organisation.org)
-
Add Aliases if needed (an alias is another address to the same mailbox, i.e. finance@ogranisation.org can be added as an alias to john@organisation.org)
-
Add the user to one or more groups if needed (A group is an address that automatically sends anything it receives to its members. i.e. beirut@organisation.org can be a group that contains several members including john@organisation.org. once an email or document is shared with beirut@organisation.org all the members of the group will receive it.)
-
Add any further security protocols (the default is usually not bad)
Google Gsuite Support Platform ( found at https://support.google.com/a/?hl=en#topic=7570177) holds help and tutorials for different administration functions.
Gmail:
Target group: all staff. Level: Beginner
Gmail, a very popular email service, offers a solid interface for email management. It is also configurable with different email applications (Outlook, Thunderbird, etc.…). Annex 02A is a tutorial on how to create a Gmail account and use the service’s interface.
Google Calendar:
Target group: all staff. Level: Beginner
One of the most important tools in any suite is the calendar. It centralizes different daily events and tasks for members of the organisation as the organisations can have shared calendars among all of its members and/or a selected number. Delving once again into the context of FIOL, Lina, the director, sets up 2 different shared calendars, viewable and editable by all:
-
Meeting Room Booking calendar: Anyone who wants to book the meeting room must do so on this by creating an event on this calendar
-
Events calendar: Any events happening for the organisation, and any member attending an external event must create an event on this calendar to reflect their participation. This would give an overview of the events managed by the organisation or that the organisation is attending
-
In addition to the shared calendars, Lina keeps her own calendar organised by creating events for every meeting, or adding reminders for tasks and deadlines. (Annex 02B is a tutorial on these functions).
Google Drive
Target group: all staff. Level: Beginner
Google Drive is a data storage service on the cloud. Other services exist (MS Onedrive, DropBox, Box, etc …) with similar or slightly different functionalities. With Google Drive, you can upload and store all your files online. Only you will have access to those files, but you can share them with your team and access them from any computer, smartphone, or tablet by logging-in to your account.
Another feature available in Gsuite Google Drive service is Team Drives. Google Team Drives are shared spaces where teams can easily store, search, and access their files anywhere, from any device.
Unlike files in My Drive, files that anyone puts in Team Drive belong to the whole team and can be seen by all of its members as soon as they are uploaded. Even if members leave, the files stay exactly where they are so your team can continue to share information and get work done.
You can store any file in Drive: pictures, drawings, videos, and more. If you store a file in Drive on one device, it will automatically be available on all your other devices. There are three ways to get your files into Drive:
-
Use the web interface (http://drive.google.com)
-
Store your files on your desktop using Google’s Backup and Sync or Drive File Stream
-
Upload files from your phone or tablet
Just like on the desktop, files and folders can be stored in Gdrive. However, the user can install one of GDrive’s offline applications to have a specific folder on their desktop synced with Gdrive. i.e. everything that happens to this folder is updated everywhere this folder exists, whether online, on the phone, on different computers, and on the web. There are two official clients for GDrive currently: Gdrive Backup and Sync, and Drive File Stream. The basic difference is that Backup and Sync by default downloads all the files in your drive for offline use entirely on your pc. Drive File Stream only downloads shortcuts of the files and needs to be explicitly told to download desired files for offline use. For the context of Lebanon, it is advisable to use Backup and Sync, as this enables users to find their files even when the connection is down.
Below is a table of comparison between Backup and Sync & Drive File stream:
|
|
Backup and Sync |
Drive File Stream |
|
Use files in My Drive |
Yes |
Yes |
|
Use files in Team’s Drives |
No |
Yes |
|
Sync only selected folders in My Drive |
Yes |
Yes |
|
Sync only individual files in My Drive |
No |
Yes |
|
Use native apps, like Microsoft Office & Photoshop |
Yes |
Yes |
|
Sync other folders, like Documents or Desktop |
Yes |
No |
|
Use with your personal Google Account |
Yes |
No |
|
Use with your work or school Google Account, like walid@fiol.org |
Maybe |
Yes |
The tutorial for Gdrive can be found in Annex 02C.
Google Docs
Target group: all staff. Level: Beginner
Gmail, GCalendar, and Gdrive are useful tools that help us communicate, share documents and folders, and organise our time collaboratively. However, the true game-changing elements that Gsuite offers are Gdocs, Gsheets, Gslides and Gforms. While each app has its own function, all share the same file manipulation (upload, download) and collaboration framework.
A word processing app, Google Docs offers all the needed functionalities to work collaboratively on the cloud.
Activity: Upload Example 001 from the Civil Society Incubator website and follow the tutorial in Annex 02D with at least 2 of your colleagues collaboratively.
This activity should cover:
-
Sharing the document with edit rights
-
Adding comments and replies
-
Chatting with people editing the document
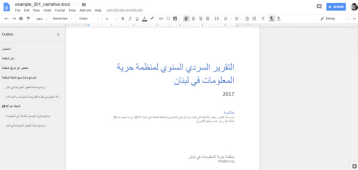
It is important to note that when you upload a document to Gdrive it remains in its original format (in our example .docx, an MS Word document).
Thus, when you try to open it, it will first open as preview file with an “Open With” menu at the top. Since we are only storing the file and previewing it in Gdrive, it is NOT a google doc yet. To convert it to a google doc, we need to choose Open With > Google Docs.
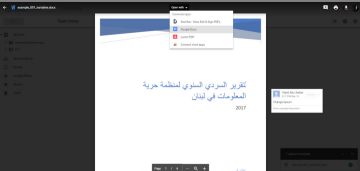
Then, google will convert the file to a google doc, while preserving the same layout including the sections, styles, and track changes
Google Sheets
Google Sheets is Gsuite’s spreadsheet processing app. With similar functions to MS Excel, Google sheets offer a great tool for collaborative budgeting and financial management. For instance, Lina, the director of FIOL, can share the budget for the workshops with the various project managers to keep track of the expenses. To do so, she uses Google Sheets.
(Annex 02E explains how to use Google Sheets).
Google Slides
Target group: all staff. Level: Beginner
Google Slides is Gsuite’s presentation app. Its functionalities are similar to MS PowerPoint, in which you can customize themes, layouts, transitions, etc …
(Annex 02F is a tutorial on how to get started with Google Slides).
Google Forms
Target group: all staff. Level: Beginner
Google Forms might be one of the handiest tools for organisations in Gsuite. It allows users to manage event registrations, create a quick opinion poll, survey participants for different projects, and much more. With Google Forms, you can create and analyse surveys directly from your mobile or web browser without any special software required. You can alsoo summarize survey results at a glance with charts and graphs.
Activity:
Meanwhile, we will build a form having the following elements: The logo of an organisation;Full Name (text); Age (Number); Gender (Multiple choices); Email (text with validation).
Then we will: Share the form for editing with a colleague; Send the form to 2 colleagues; Fill the form up with mock data; Check the response sheet of the form.
(To do so, follow the tutorial in Annex 02G).
Moreover, Gsuite offers 2 other tools useful for video conferencing and online meetings:
-
Google Hangouts, which you can use for a chat conversation or video call. It is accessible through http://hangouts.google.com .
-
Google Meet, where you can set up a meeting and send the code to participants to join. Accessible through https://meet.google.com . For a tutorial check Google’s Learning Center: https://gsuite.google.com/learning-center/products/meet/get-started/#!/
ICT tools for Monitoring and Evaluation
Monitoring and evaluation is an essential operation for organisations to surveil their performance and achieve their goals through data collection and indicators. Though this module’s scope does not cover M&E techniques, it is important to know how to design any type of data collection form for your organisation’s M&E practices. The questions listed here will help mitigate the risk of asking unmeasurable questions in our forms, thus greatly diminishing the amount of work that the data analysis would take.
In specific, this section will shed light on the data collection forms creation, data storage, and data analysis components of the M&E process.
Data collection forms creation
Consider the following scenario:
Sami, the M&E Officer in FIOL needs to collect the biodata (name, age, address, etc) of trainees in the workshops that FIOL’s Cyber Rights programme conducts. According to his indicators, he needs to know in total:
-
How many people were trained?
-
What is the gender distribution?
-
What is the age group average?
-
What is the geographical distribution of the beneficiaries?
-
Is this their first participation in a Cyber Rights related workshop?
-
Why are Cyber Rights important to their daily lives?
Of course, some of these questions are more suitably found in a Pre and Post assessment for each workshop, however, for the sake of this example, we are going to assume that this is merged in one form.
Let us start by building the form:
|
First Name |
Family Name |
|||||||||
|
Age Group |
Gender |
|||||||||
|
15 – 24 |
25-34 |
35-44 |
45 and above |
Male |
Female |
|||||
|
Location |
South Lebanon |
Beirut/Mount Lebanon |
Have you ever participated in a Cyber Rights activity? |
|||||||
|
Bekaa |
North Lebanon |
Yes |
No |
|||||||
|
I think Cyber Rights are an important freedom issue |
Strongly disagree |
|||||||||
|
Disagree |
Neither agree nor disagree |
|||||||||
|
Agree |
Strongly agree |
|||||||||
After developing the questions, (Annex 03A provides tips on how to do so from an M&E perspective), digitising the data collection form will allow you to organise and analyse the data easily and efficiently. Before we introduce the platforms, it is important to note the following:
-
Decide beforehand if you will be using a survey or a data collection tool. For instance, a Data collection tool is much more practical for questionnaires than a survey tool, although the latter can also carry out a questionnaire. Check Annex 03B for a comparison and better understanding of both.
-
Once the data collection process is launched on any digital platform, it is absolutely NOT RECOMMENDED to change or add questions. Similar to any data collection process, you will have to recollect all the data for the changed or new questions. For this reason, always pilot your data collection either through focus groups or even internally.
-
Hand in the results to the M&E team and make sure they are able to extract the data they need for analysis. This will mitigate the risk of redoing the work and increasing the costs.
-
Once the pilot is over and the M&E department is satisfied with the process, you may launch your data collection.
In a nutshell, it is best to use Survey tools for assessments or in a general context, and Data Collection platforms for information about beneficiaries and monitoring of their with your programme.
A plethora of surveying and data collection platforms exist, with almost the same functionalities We chose here to look at 2 platforms:
-
TypeForm ( https://www.typeform.com/ ) as a surveying tool
-
Kobo Toolbox ( http://www.kobotoolbox.org/ ) as a data collection platform
With these tools, we are going to use Google Forms to apply our Trainee Registration Form and create a responses sheet.
TypeForm
Target group: M&E staff. Level: Beginner
TypeForm is a handy and easy to use survey tool.
. The functionalities and steps for surveys are mostly the same for any surveying tools. You can find TypeForms tutorials here: https://www.typeform.com/help/my-1st-typeform/ or in Annex 03J. and learn more about this tool here: https://www.typeform.com/help/category/create/
Kobo Toolbox
Target group: M&E staff. Level: intermediate
On their website, the Kobo Toolbox team identify the platform as “a suite of tools for field data collection [used] in challenging environments.” Thus, most “users are people working in humanitarian crises, as well as aid professionals and researchers working in developing countries. “
This platform is built on the Open Data Kit (ODK) technology, which is a free and open-source set of tools which help organisations create and manage mobile data collection solutions, through the below options:
-
Build a data collection form or survey (XLSForm is recommended for larger forms);
-
Collect the data on a mobile device and send it to a server; and
-
Aggregate the collected data on a server and extract it in useful formats.
While ODK requires advanced ICT skills in order to be set up and used, Kobo Toolbox, provides a user-friendly interface. It has an important feature called Offline ability. Users can fill the forms while being offline and submit the data once the device connects to the internet. This feature is available through web browsers as well as through Kobo Collect, the Android Kobo data collection app. KoboToolbox does not have an app for IOS devices yet (ie. Apple), however, data collection can be done through the web browsers on IOS (the details on how to perform offline data collection can be found in Annex 03F).
To use KoboToolbox, we can either create an account on the freely available instance (an instance is a single installation of an application) https://kobo.humanitarianresponse.info provided by UN OCHA or install it on the organisation’s servers.
Since the latter requires advanced ICT skills, we are going to use the freely available server.
Going back to our user case scenario, Sami, the M&E Officer of FIOL has already developed the form (Example 03A). Now, he needs to:
-
Create an account on the platform
-
Create the form
-
Add questions to the form
-
Review the questions and add skip logic if needed
-
Skip logic is the process of skipping questions depending on the answer, example:
-
Question A: Do you have children? Possible Answers: Yes, No
-
If “Yes” is answered, Question B: How many children do you have?
-
If “No” is answered, Question C: are you planning on having children?
-
-
Obviously, if the answer of Question A is “No,” we do not need to ask Question B and, we tell the form to skip Question B and go directly to Question C. This is called skip logic.
-
-
Preview the form
-
Save the Form
The next table depicts the types of response that a form can have.
Table 03-B Response Types in KoboToolbox
So far, Sami created the form and saved it (see Annex 03C for the tutorial). Note that the last step is deploying the form. To ”deploy” in KoboToolbox means activating the form for other people to access and use it. After deploying the form, Sami needs to send the link to the people who will be using it. However, there is still one last step he must do which is providing permissions.
Sami wants his data collectors to be able to submit the forms, thus he needs to follow the steps below:
-
Go to the form’s Summary
-
Click on the Share Form on the left panel
-
Start adding the users and their permissions
-
If you need to add two or more permissions for the same user, you need to repeat the same previous step
Sami has given different level of permissions to different users, ranging from permission to submit, to validate, and to edit. Note that once permissions have been added, users are going to see the forms in their panel, as soon as they log in
As soon as the forms are submitted by collectors, and the data is validated, Sami will have to export the data. The best format to do so is CSV (a text file with Comma Separated Values), as it is readable by most of the analysis software and importable into Excel and into different databases. Sami begins by clicking the Data tab. There, he can:
-
Print a pre-set report with different charts and tables reflecting the data. Sami can also change the shape of Charts.
-
View the data in a form of a table, with the validation status.
-
Check the photos, if the form contained any photo submissions, in the form of a gallery
-
Download the data in different forms.
-
View a map in case the form had a geolocation field.
(Check Annex 03D for permissions and export tutorial).
Note that Sami can also share the forms to be edited by other users, or he can delete the forms and their data(check Annex 03E for different management functions).
Updated tutorials and help can be found on KoboToolbox’s help site at http://help.kobotoolbox.org.
It is important to reiterate that KoboToolbox is a data collection tool. Its main function is to produce clean digital data. The next step after data collection is to analyse this data according to the project’s indicator and then visualise it, i.e. build charts or infographics, for different purposes.
The exported files from KoboToolbox can then be imported into different tools and services, be it statistics software like SPSS or reports builders like Google Data Studio. Sami can also give the data to the information officer who in turn can import the data to the databases they are both using. Furthermore, pivot tables and charts can be built using this data in spreadsheet processors like Excel.
Google Forms Revisited
Target group: M&E Staff. Level: Beginner.
Activity:
-
Create a google form for the Trainee Registration sheet
-
Fill out 5 entries using the Preview Form button
in the upper right menu
-
Generate a Responses Sheet
-
Use Explore in the bottom right to insert the following charts :
-
Count of Gender as a pie chart
-
Count of Age as a bar chart
-
The internet: A brave new world
The internet might be one of the biggest achievements of the 19th century, related to the communications fields. With each increment in the infrastructure, the internet assumes more functions.
The internet is a network made up of a collection of devices which are linked through a physical internet infrastructure. The world wide web is a collection of websites, platforms, applications and services provided over the internet. These can be smartphone applications, operating systems, online services, email services, online games, websites, etc.
Websites are created using the basic language for the internet: Hyper Text Markup Language or HTML. An array of other languages that are used for web apps and platforms also exists, however all these languages must be used in an HTML context. i.e. while you might have heard of php, asp, JavaScript, ruby, etc. as languages to develop websites and web apps, the resulting app or even the code of the app itself must be embedded in HTML code to be accessible on the internet. It is worth mentioning that like applications, programming languages are subject to iterations, i.e. they are improved and updated and hold versions.


Content Management Systems
Target group: all staff. Level: Beginner
While ICT experts can build HTML websites, the process is made more accessible through the use of a set of web platforms called Content Management Systems (CMS).
A content management system is a platform, or web application, that is used to author, edit, and publish digital content. This content can be anything from text to multimedia to interactive graphics or videos, and can be created, managed and published by many authors. Content management systems, in general, have the following characteristics:
-
A core package that usually carries out main functions like user management (registration, login, profile and security, roles, and permissions), content publishing (writing, publishing, and editing of articles and posts, and assigning permissions on the access of these), and information management (creating categories, sections, taxonomy, and relating content to these).
-
Functionality which can be expanded through easily plugging in packages of code usually called plug-ins, modules, or extensions, allowing them to stay up to date with current technologies and services. (ex: adding a newsletter engine or a login with Facebook capability)
-
Easily applied new designs and colors through packages of code, designs, and images called themes or templates
-
Basic functionality which most of the time does not require a developer to achieve. However, it usually requires a person knowledgeable in ICT.
While CMSs streamline the creation of modern websites, with ease of updates and top-notch technologies and standards, they can also pose a challenge, once one needs to customise them or add very specific functionalities. However, with the use of open source CMSs, the online community usually offers a huge helping hand. Most of the questions and challenges are answered or can be answered promptly, and most of the challenges and solutions are documented by different users.
The most commonly used CMSs are WordPress (as noted above), Joomla, and Drupal. All three are available in open source and are mainly free. Although they are different in structure, composition, and even language used, they have the same functionality. However, the differences make each CMS suitable for a certain scope. Also, while all three can achieve the same look and feel for the website or platform visitors and users, their backends (what administrators, authors, and developers use) are different.
Wordpress (https://wordpress.org/)
Currently the most used CMS is WordPress. WordPress themes and plugins are widely available and purchasable from various sources through wordpress.org, allowing users to design and customise their website. Although it started its life for simple blogs, this CMS is now used for small to medium websites, ranging from portfolio websites to light news portals. It is not advisable to use WordPress for complex platforms and websites. Although it has a vibrant online community with plugins and themes easily updatable through its interface and plays well with Right-to-left (RTL) websites using languages like Arabic. Some features, however, like bilingual websites require buying additional plugins. A little money put in this CMS can go a long way, and it is always advisable to budget yearly for its maintenance and plugins, as most of the plugins and themes are paid.
Joomla (https://www.joomla.org/)
Joomla is an old player in the CMS world, and serves primarily medium to large websites. Joomla also has an active online community and large availability of extensions (plugins) and templates (themes). It plays well with right-to-left languages, and bilingual websites. Joomla, with its extensions and templates, is easily updatable through its interface. However, it may at times require the intervention of a web developer. Just like WordPress, it is advisable to set a yearly budget for a Joomla instance as most fully functional extensions are paid.
Drupal (https://drupal.org)
While Drupal is the hardest system to use, it is also the most flexible, customisable, and information-driven CMS among the three. This CMS is a multi-tool and can be used to build web applications, huge portals, and intranet (a network of services internal to organisations) services. It plays very well with RTL and bilingual websites, and it also offers the most extensive api (application programming interface, a way for different web applications to talk to each other) to open up to different web apps. While the most elaborated themes (templates) available are priced , the majority of its modules (plugins), as well as its themes, are free of charge. Moreover, Drupal’s community is big, and knowledgeable. However, a developer is most certainly needed for the building, update, and maintenance of this CMS and the availability of developers in Lebanon who are experienced in Drupal is scarce, although they can be hired online.
In conclusion, each CMS has its niche, and for an organisation looking to showcase its portfolio, events, and activities, WordPress is most certainly recommended. .Most of the hosting companies (like godaddy.com, bluehost.com, 000webhost, and even wordpress.com) offer one-click installation of WordPress in addition to the domain purchase.
Annex 04A is a tutorial on how to create a self-hosted WordPress site. The process is the same across different hosting resellers.
Conclusion
This module was written with small and medium non profits mind, applying different skills to different business functions, but can be used by other types of companies alike as it covers various specifics relevant to ICT tools. Special care was taken to include the links to online resources and tutorials, in particular, those pertaining to MS office and Google Suite, and that is taking into consideration that the interfaces and functionalities will change / update and some of the information in the annexes would thus become outdated.
This module is not intended to be of advanced nature, it does, however, introduce some advanced notions and leaves it up to the reader to further explore those notions. We hope it serves to enhance grassroots and more established organisations in developing more effective internal processes and facilitating their work., activities, and deliverables, as well as communication efforts.
Bilingual Glossary
|
Alias |
الاسم المستعار |
|
Backups |
النسخ الاحتياطي |
|
Blog |
مدونة |
|
Caption |
شرح |
|
Clients |
برنامج خاص بالخدمة |
|
Cloud |
سحابة |
|
Collaboration framework |
إطار التعاون / العمل المشترك |
|
Content management system |
نظام إدارة المحتوى |
|
Cyber rights |
الحقوق السيبرانية |
|
Data |
البيانات |
|
Data centers |
مراكز البيانات |
|
Delving |
الخوض |
|
Edit rights |
حقوق التحرير |
|
Extensions |
ملحقات / اضافات |
|
File manipulation |
التصرّف بالملف |
|
Fonts |
الخطوط |
|
Fully-fledged |
كامل الوظائف |
|
Granularity |
تقسيمات |
|
Hardware |
المعدات، أجزاء الحاسب |
|
Header |
رأس |
|
Hosting companies |
شركات الاستضافة |
|
Infrastructure |
بنية تحتية |
|
Learning curve |
رحلة التعلم |
|
License |
رخصة |
|
Markup |
وضع علامة على |
|
Matrix |
مصفوفة |
|
Mnemonic |
ذاكري |
|
Modules |
وحدات |
|
Office suites |
حزمة مكتبية |
|
Open source |
المصدر المفتوح |
|
Pivot tables |
الجداول المحورية |
|
Platform |
منصة |
|
Plug-ins |
المكونات الإضافية |
|
Presentation processor |
معالج التقديم |
|
Replicas |
النسخ المتماثلة |
|
Resolve |
حل |
|
Server |
الخادم |
|
Shortcuts of the files |
اختصارات الملفات |
|
Slide master view |
عرض الشريحة الرئيسية |
|
Software |
البرمجيات |
|
Spreadsheet processor |
معالج جدول البيانات |
|
Tab |
التبويب |
|
Table of Content |
قائمة المحتويات |
|
Theming |
سمات، قوالب |
|
Tutorial |
وثيقة / محتوى تعليمي |
|
User experience |
تجربة المستخدم |
|
User interface |
واجهة المستخدم |
|
Variant |
مختلف |
|
Watchdog |
حيثية مراقبة / حراسة |
|
Web interface |
واجهة ويب |
|
Word processor |
معالج الكلمات |


