
Evidence-based research forms the backbone of any serious attempt to produce knowledge about society or understand social, cultural, and political phenomena, behaviors,and attitudes, in order to devise the adequate responses and interventions (whether in programming or policy making). Hence, this module provides civil society organisations, actors, practitioners in Lebanon with basic concepts in research design and practical guidelines to optimise the use of research method tools in their work.
It is divided into five main sections. The first two sections, forming the building blocks of this manual, introduce the reader to the general process of scientific research and explain the main approaches, goals, and characteristics of empirical research (sections 1 & 2). The following two sections tackle in greater detail the methods of qualitative research (section 3) and quantitative research (section 4) respectively, including the process of data management and data analysis. Finally, the last step in the research cycle will address the writing up and presentation of the research findings (section 5).
This guidebook was developed as part of “Ta’cir - Towards an Active Participation of Civil Society in The Reform Process” implemented by ACTED in partnership with Lebanon Support, Akkarouna, and Sheild, and funded by the European Union. It is published as part of the Civil Society Incubator, a programme by Lebanon Support.

Introduction
While civil society organisations in Lebanon are playing an important role in identifying social issues and addressing social problems, the use of evidence-based research and planning by civil society actors and practitioners remains limited. This broken link between systematic social inquiry and evidence-based research produced by the social sciences and civil society’s work has led, in many instances, to ill-informed decision making, interventions, and policies.
Evidence-based research forms the backbone of any serious attempt to produce knowledge about society or understand social, cultural, and political phenomena, behaviors,and attitudes, in order to devise the adequate responses and interventions (whether in programming or policy making). Hence, this module provides civil society organisations, actors, practitioners in Lebanon with basic concepts in research design and practical guidelines to optimise the use of research method tools in their work.
It is divided into five main sections. The first two sections, forming the building blocks of this manual, introduce the reader to the general process of scientific research and explain the main approaches, goals, and characteristics of empirical research (sections 1 & 2). The following two sections tackle in greater detail the methods of qualitative research (section 3) and quantitative research (section 4) respectively, including the process of data management and data analysis. Finally, the last step in the research cycle will address the writing up and presentation of the research findings (section 5).
Section 1. Thinking Like a Researcher
1.1 Thinking like a researcher: What is evidence-based knowledge?
Clear assessments of needs are necessary for civil society organisations to optimally and efficiently plan, design, implement, and advocate for their interventions, whether at a programmatic or policy level. Hence, it is important to understand and be trained in basic research skills. The importance of this lies in the emphasis on critical thinking and evidence-based analysis which takes us beyond repeating stereotypes, pre-judgments, or inaccurate and reductionist problem assessments. It is necessary to gather data on the topic of interest for the CSO and to try to systematically analyse and understand the phenomena under study before we move to designing interventions or proposing policies.
1.2 The Research Cycle: Deductive and Inductive Approaches
Scientific research operates at two inter-connected levels: the theoretical/conceptual level and the empirical/data driven level (Figure 1). While the theoretical level is concerned with coming up with a conceptual framework that can understand and analyse a social phenomena, the empirical level attempts to systematically observe, explain, and eventually predict, the relation between certain phenomena.[1] It is grounded in evidence and attempts to test, refine, or build theories based on data and observations. Scientific research is, thus, driven by a systematic and organised process of data collection and analysis based on which our understanding of social phenomena and our diagnosis of social conditions are shaped (theory-building/inductive approach) or tested (hypothesis-testing/deductive approach).
Figure 1. The Research Cycle
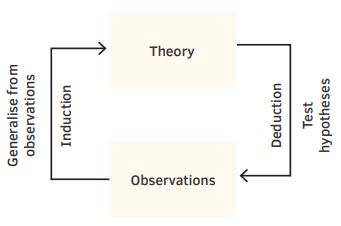
Source: Bhattacherjee (2012, p.4)
As shown in Figure 1, there are two main approaches to research:
- Deductive Approach: Also called the “theory-testing” or “hypothesis-testing” approach. In this approach, the research cycle starts with taking a certain existing theory or hypothesis and testing it using new empirical data or observations. The goal of the deductive approach usually goes beyond just testing a theory and attempts to refine, improve and fine-tune previous research in light of new empirical data.
- Inductive Approach: Also called “theory-building” approach. Here, the research cycle starts with the observations and empirical data to then make an inference at the theoretical/conceptual level. An example of this approach is “grounded theory” where the researcher systematically analyses and categorises empirical data and observations to develop concepts, and definitions, and to generate a theory.
It is crucial to note that practitioners in civil society organisations cannot operate without developing skills at both the conceptual and the empirical level. Great theories have no value if they cannot be used to make sense of reality. For example, the theory of intersectionality that was developed by feminist scholars in the US gained much acclaim because it was able to link the theoretical work to the actual activism of progressive groups that started to focus their understanding of social inequality on the intersection of class, gender, and race (among other axes of inequalities). Similarly, statistics about the number of women killed monthly by their husbands can be useless if this is not put in the broader context of patriarchy and if it is not explained at a theoretical level that helps us understand why we have such high rates of domestic violence, and thus develop adequate interventions to fight it.
1.3 What are the types and characteristics of evidence-based research?
There are three main types of research, depending on the aim of the research: First, exploratory research is usually conducted when the research deals with a topic/problem that is unknown in magnitude, with not much reliable data available on it. It provides an initial idea about the scope of the topic/problem and an opportunity for further in-depth research in the future. Second, descriptive research aims at providing in-depth, systematic, and precise description of a certain social phenomenon. It asks the who, when, where, and what questions.
Third, explanatory research asks the questions of why and how, and attempts to find causal relationships and mechanisms by linking the empirical level (observation) to a theoretical level (explanatory) in order to explain social problems or behaviours.
Six main characteristics have to be realised in order to consider these types as scientific.
- Verifiability/Falsifiability: Science can only deal with questions for which verifiable evidence can be found, notably through testing. Thus, scientific knowledge should be falsifiable. In other words, it should be subject to testing and can be disproved by the emergence of new knowledge or data. Any knowledge that cannot be falsified falls outside the realm of scientific inquiry.
- Systematic Exploration: Scientific research is systematic, organised, planned, and follows clear steps (explained below).
- Reliability: Refers to the repeatability of findings. For the findings to be reliable, we should get the same results if we repeat the research.
- Validity: Refers to the credibility of the research. For the findings to be valid, we should make sure the research design is using the correct procedures to test, measure or explain the examined question or problem. Rigorous research designs should pay special attention to both internal validity (extent to which results are attributed to the variables explored in the research) and external validity (extent to which results are generalisable). In order to increase the validity of a research, triangulation (using more than one method or research to investigate the same phenomenon) can be used. This will be further developed in the next section.
- Precision / Accuracy: Scientific knowledge is precise and accurate. It does not use vague terms or unclear descriptions, and it refrains from making unsubstantiated generalisations.
- Predictability: Scientific knowledge could sometimes be used to predict potential scenarios or trends for the future of the topic under study, based on previously depicted trends. Worth noting, however, that this does not mean that these predictions will necessarily materialise.
1.4. What are the steps of the research process?
Research process can be summarised in the following seven steps:
Figure 2. The Seven Steps of the Research Process
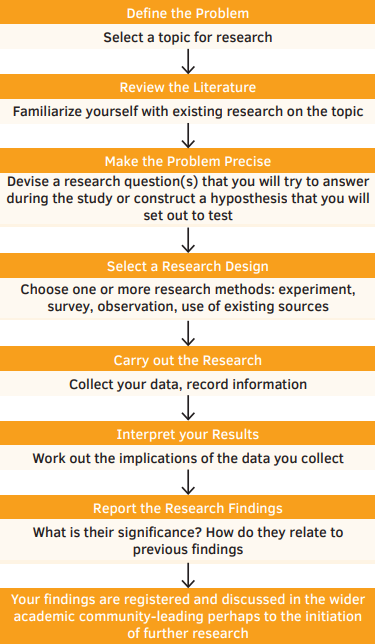
- Majed (2016, p.17)
- Define the Problem: Problem Statement
The research process usually starts with the choice of a broad research topic. This choice can be based on a personal interest in the topic, on the interest of your organization, or it could be based on the observation of a certain social change, or the need for new policy interventions after a sudden crisis (like the breakout of wars and their ensuing refugee crises). At this stage, the researcher states the problem to be studied and defines it in broad and general terms to be narrowed down at a later stage.
- Review the Literature
The second step in the research process is the reading of the relevant research that has been previously conducted in the same field and on this specific topic. At this stage, the researcher has to review the following sources of data:
- Primary sources: which include first hand evidence of the topic under study, such as interviews conducted by the researcher, results of surveys, and questionnaires collected by the researcher, original historical texts, legal documents, artworks, speeches,etc.
- Secondary sources: which include information or evidence produced to analyse primary sources of the topic under study, such as scholarly books, articles, reports, newspaper articles, etc.[2]
- Tertiary sources: which include sources that index and organise both primary and secondary sources, such as dictionaries and encyclopedias.
At the end of this step, the researcher should have a clearer idea about the state of knowledge in the field of study and should be able to better choose her entry point into the research topic.
Checklist: Below are some questions to ask at this stage:
- What are the most prominent trends/theories/concepts in the literature you reviewed?
- Who are the most leading theorists, authors, and researchers on your topic?
- Which aspects of the topic are still not well covered?
- What are the gaps that your research can contribute to?
- Make the Problem Precise: From Problem to Research Question(s)
Based on the literature review, the researcher should be able to narrow down the focus of her research and to choose a specific angle to focus on. This can be done by moving from the broad research problem to formulate the main research question or specific hypotheses to be tested (if it is adopting a deductive approach).
- Select the Research Design
The researcher can decide now on the research methods well suited to addressing the research question. Questions of validity, feasibility, and access are at the core of this decision. Moreover, the researcher also has to develop her sampling design at this stage. Once the research design has been selected, the researcher has to develop the research tools to be used (surveys, questionnaires, etc.). At this stage, operationalisation is carried out: the researcher designs precise measures for the variables in the conceptual and theoretical framework they are dealing with in their research. Additionally, the researcher has to start preparing tools for data collection, management, and analysis, and forecasting the possible obstacles occuring during the data collection phase and how to tackle them.
- Carry out the Research: Data Collection
Here, the researcher collects data methodically using the tools chosen and developed in the research design in the previous step (this could be through fieldwork or statistical data generated by surveys or questionnaires). It is crucial at this point that the researcher respects research ethics and puts them to practice.
- Interpret the Results: Data Analysis
Upon finishing data collection, the researcher usually ends up with copious data in need of organisation and analysis.
Tips: Data analysis can be a discouraging and lonely process, follow the below steps to successfully analyse your data:
- Be organised and systematic
- Select relevant data and set aside what is irrelevant (you may eliminate them after finishing your research)
- Sort and organise your data manually or Use software tools such as Excel, SPSS, STATA, or R for statistical data, and NVIVO, MAxQDA, or Atlas for qualitative data
- Find trends and common themes in the case of qualitative data or establish a statistical model in the case of statistical data
- Report the Research Findings: Writing up the Research Paper
The writing up of the research findings is the last step in the research process and it is an important one since it is where the researcher disseminates the findings of the study. Researchers should seek to report major trends that the data supports, as well as outliers and exceptions. They should make sure to be objective, precise and accurate while doing so. Lastly, they should acknowledge the prejudices and biases (their subjectivity) that might affect their interpretation of the research findings. Some researchers prefer to share their subjectivity with their audience in the introduction of their research or while reporting on the findings at the very end of their studies.
Objectivity and Subjectivity
The debate around objectivity and subjectivity in scientific research has preoccupied social scientists for a long time. However, with the decline of positivism (which believed that science is completely objective and true) since the 1960s, researchers today acknowledge that while objectivity remains at the core of scientific research methods, it is also important to acknowledge the subjectivity of the researcher in order to try and limit it. Scientific knowledge is objective in the sense that it studies social phenomena as they are, not how they ought to be, or how the researcher would have liked them to be (to serve her own agenda or her beliefs). To be objective, one has to carefully follow the steps of the research process, and systematically study the research problem while being aware of, and guarding against, their own biases, beliefs, wishes, values or preferences. Another important way to limit subjectivity is to always ask oneself the reverse question while analysing: “why not?”. This will help the researcher curb the effects of their own prejudgments and biases. Finally, it is always good to cross-check our analysis and to have more than one researcher on board for the project. This can also considerably limit subjectivity.[3]
1.5. Research Ethics
Below are some of the main ethical considerations to be made when thinking about our research ethics:
- Truthfulness: The researcher has to clearly and trustfully explain the research (topic, design and objective) to research participants. They also have to trustfully convey the answers of the participants in their research, without making any adjustments to fit their research agenda.
- Anonymity: Ethical scientific research may entail protecting participants’ identities by not using their names and not providing any details that could link to their identity, unless they explicitly state otherwise.
- Confidentiality: The information gathered throughout the research should remain confidential and no one should have access to it other than the researcher(s).
- Trust: The researcher should try to build trust with the participants in order to access truthful, reliable, and valid data.
- Informed Consent: Participants should give their informed consent after they have read the information sheet that explains the research and that clarifies their rights as participants. Researchers should never use intimidation or coercion to add participants to their sample.
- Withdrawal: Participants have the full right to withdraw at any point throughout the research and without a need for justification.
- Recording: Researchers should not voice record or videotape an interview without the consent of the participant. If consent is not granted, notes taking becomes the resort for the researcher.
- Deception or False Hope: In many cases, especially in the work of CSOs, research respondents might think that their participation in the research might bring them better living conditions or a solution to their problems. The researcher should always make sure not to give false hope or use deception in order to attract participants to their research.
- Vulnerability: A major aspect in research ethics lies in the respect of people’s vulnerabilities and emotions, especially if the research involves a heavy psychological aspect (traumatic war experiences, refugees, etc.).
- Safety: There is no knowledge that is worth putting our safety, or the safety of our participants, in danger for. In ethical terms, safety does not only include physical safety but also economic, social, emotional, and psychological safety.
- Humbleness and Humility: The researcher has to always be humble and thankful to their participants. It is unethical to deal with superiority with participants or to consider that people’s time and stories should be at the disposal of the researcher (even if there is consent).
- Feedback: participants should have the right to see the research results before they get published and to provide feedback that is to be respected in case they think that the research has misrepresented them.
Section 2. Understanding Research Design
2.1 Choosing your Research Method: Qualitative vs. Quantitative Methods
There are two main types of research methods: qualitative and quantitative (see Figure 4). Qualitative research methods help us dig deep into a phenomenon and understand the motivations, and reasons behind certain attitudes or behaviours. It therefore unravels the mechanisms and processes that shape a certain social phenomenon. On the other hand, quantitative research is generally used to quantify a problem by generating numerical data and statistics. It is usually a method used when one is interested in a mapping or in studying a phenomenon at a large scale.
The choice of research method usually depends on the research question and on feasibility. Some research questions are more qualitative or quantitative by nature. For example, if the research question is about the everyday experiences of Syrian refugees in Lebanon, a qualitative research design seems to be more fit to answer it since in-depth information, rather than statistics, is needed in order to understand the everyday experiences of people. However, if the question is about the schooling (access to education) of Syrian refugees in Lebanon, a quantitative research design could be more useful since numerical data can give us indicators about who and how many refugees have access to education. Some questions can be answered using both methods, this is referred to as a mixed-methods approach. For example, quantitative research gives us an idea about the main trends regarding a certain phenomenon (like increasing divorce rates in Lebanon) but it doesn’t help us explain why people replied in a certain way or what are the processes, emotions or reasoning behind certain behavior (i.e. divorce). In such cases, combining the quantitative data with qualitative in-depth interviews for example can help shed light of the dynamics and processes behind the increasing divorce rates.
Similarly, the research method is often determined by practical matters of feasibility. Access to a certain area or community, security considerations, availability of a research team and funding play important roles in determining the research design.
Figure 4. Comparison between Qualitative & Quantitative Methods
|
Qualitative Methods |
Quantitative Methods |
|
Uses qualitative observation, ethnography, participant observation, and interviews (individual or focus groups) |
Uses quantitative measurements and statistical data |
|
Micro-level analysis: Zoom-in to depict details |
Macro-level analysis: Zoom-out to depict trends |
|
In-depth, rich and detailed information |
General and sometimes “superficial” information |
|
Can only cover a small sample (not representative) |
Can cover large samples (representative) |
|
Non-generalizable |
Generalizable |
|
Data collection and analysis is time consuming |
Data collection and analysis can be done relatively quickly |
|
Not very costly |
Can be very expensive |
|
Main Biases:
|
Main Biases:
|
|
Results are reported in the form of anecdotes, stories or images based on which the analysis or theory is developed |
Results are reported in the form of tables, graphs and statistics based on which analysis is provided. |
2.1.1 Triangulation
As previously discussed in Section 1, the validity of the research is crucial in order for it to be solid and convincing. Triangulation means that the empirical evidence of the research is cross-checked through more than one method, more than one source, more than one dataset or more than one researcher. Triangulation is usually used to fill in the missing information in the research or to validate information through using other sources or tools. In both cases, triangulation helps increase the research validity and provides a more comprehensive analysis of the phenomenon under study. Therefore, triangulation can play an important role in the research design.
2.1.2 Unit of Analysis
It is important to specify the unit of analysis of the research in order to be able to develop accurate research designs. The unit of analysis refers to the target of the investigation. Typically, the unit of analysis could be individuals, groups, organizations, countries, etc. For example, if we are interested in studying people’s attitudes towards refugees, the unit of analysis in this case will be the individual. If we want to study characteristics of political parties or labour unions, then the unit of analysis will be the organisation. If our research is concerned with understanding differences in national cultures, then the unit of analysis will be the country. Once we define our unit of analysis, we should then be able to devise research methods well-suited to our research and determine variables that affect the target of investigation.
2.2 Sampling
Another crucial aspect of any research design is sampling. Since it is impossible for researchers to cover everyone in the population of study (too expensive and time consuming),[3] we resort to choosing samples from the population or the target group of our study that can help us form a clearer idea about what is happening with regards to a certain phenomenon or in society at large.
Figure 5. Types of Sampling
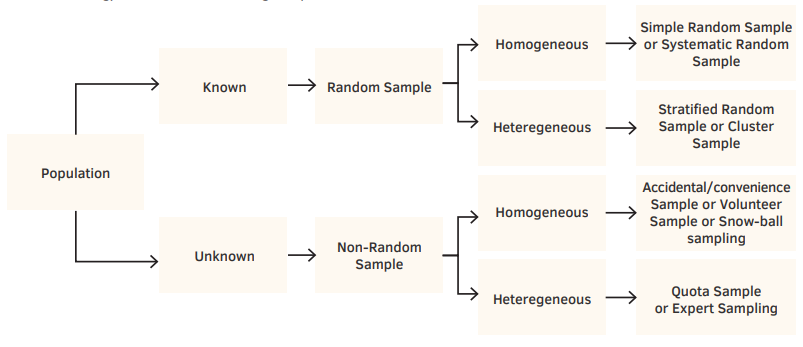
Random Samples: i. Simple Random Sample:
Number the subjects in the sampling frame. Generate a set of these numbers randomly.Sample the subjects whose numbers were generated.
Systematic Random Sample: Start by selecting a subject near the beginning of the sampling frame list, skip several names and select another subject, skip several more names and select the next subject, and so forth. The number of names skipped at each stage (k) depends on the desired sample.Denote the sample size n and the population size N. Let k=N/n, the population size divided by the sample size. The number k is called the skip numberTo obtain a systematic random sample:
Select a subject at random from the first k names in the sampling frame, andSelect every kth subject listed after that one. Stratified Random Sample: A stratified random sample divides the population into separate groups, called strata, and then selects a simple random sample from each stratum. Stratified random sampling is called proportional if the sampled strata proportions are the same as those in the entire populations. Ex: if 90% of population is Lebanese and 10% are refugees, then the sample size of Lebanese should be 9 times that of refugees.
Stratified random sampling is called disproportional if the sampled strata proportions differ from the population proportions. This is useful when the population size of a stratum is relatively small. Ex: Although 90% of population is Lebanese, a disproportional sample will include 50% Lebanese and 50% refugees.
Cluster Sample: Simple, systematic and stratified random sampling are often difficult to implement because they require a complete sampling frame. Cluster sampling is useful when a complete listing of the population is not available.
To obtain a cluster random sample:
divide the population into a large number of clusters, such as city blocks. Select a simple random sample of the clusters. Use the subjects in those clusters as the sampleExample: A study about patient care in hospitals in Lebanon could first randomly sample hospitals (the clusters) and then collect data for patients within those hospitals.
Non-Random Samples:
Accidental/Convenience Sample: This type of sampling, known as ‘grab sampling’ or ‘man-in-the-street’ sampling, is one of the most common non-random sampling techniques. The sample is selected because it is accessible to the researcher in an easy, cheap, and least time consuming manner. However, the limitations of non-random sampling remain a major obstacle preventing the generalization of findings based on such samples.
Volunteer Sample: This is a sampling method that relies on people volunteering to participate in the study. It is a very widespread method of sampling that we see mainly in online surveys.
Snow-ball Sample: This type of sampling is usually administered when the target population is unknown and hidden (access to it is difficult). It is also typical of sampling techniques within small populations since snow-ball sampling relies on network effects: the researcher asks the initial participant to identify another potential participant for the research, and so on. The main limitation with this type of sampling is that it is hardly representative, relying on one network of people who all know each other or are closely linked to each other, which can blur or skew the research outcome.
Quota Sample: It is a type of stratified random samples in which selection within the strata is not random. The researcher decides the representation of the subjects (proportional or not) depending on the characteristics that are relevant to the quota. This type of sampling is less costly and easier to administer when the sampling frame is missing and the information is urgently needed. For example, if an organisation is working on an advocacy campaign against domestic violence, it can choose to cover experiences of domestic violence against women from different regions / governorates in Lebanon. Therefore the sample will include women from each governorate in Lebanon based on a quota.
Expert Sample: This is a sampling technique where respondents are chosen based on their expertise and knowledge on the phenomenon being studied.
Section 3. Qualitative Research Methods
3.1 Characteristics of Qualitative Research
Qualitative research is a flexible research method that gives the researcher enough room to use their skills in extracting information and fine-tuning the research method as they go. It is not as rigid as quantitative research methods. This can involve more subjectivity, but it can also shed light on social phenomenon in more accurate and descriptive ways. It has three main characteristics:
It can help further our understanding of social phenomena that are unclear to us, away from normative judgments and stereotypes. It can specifically uncover behaviours, attitudes, dynamics, mechanisms, and interactions in the social world.It can help in gathering in-depth information that quantitative methods cannot cover.
3.2 Data Gathering Through Qualitative Research
There are several qualitative research methods that can be used to gather data:
Individual Interviews: The most typical form of interview, where the researcher sits with the respondent (in a place of their choice, i.e. in their home, office or in a public place) and asks him/her questions related to the research. Individual interviews give access to in-depth information, and allow the researcher to delve into the details of the topic of research. It also helps better understand the mechanisms that shape people’s perceptions, attitudes, and behaviours. Interviews can also be carried out over the phone, email, or other online mediums such as Skype. Sometimes it can be more beneficial to have a phone interview when researching a sensitive topic, or if your participants are vulnerable and do not feel safe to meet face-to-face. Although, interviewing can generally be very rich and useful, it also has limitations linked to the bias that can arise from the researcher, and the influence the researcher can have on the answers of the interviewee (such as leading the interviewee to give certain answers).
Focus Groups: This method is a variation of the individual interview. Instead of interviewing one person at a time, focus groups rely on group interviews (usually 5-10 respondents are interviewed together). In this method, the interviewer is not the investigator but rather plays the role of a facilitator, that moderates the discussion. Focus groups allow the researcher to observe the interaction and debate between participants over a certain topic, and it opens the door for a deeper examination of the topic since the format of a discussion might trigger ideas and responses that people would not think about in a survey or a personal interview. It is also useful if the researcher is concerned specifically with examining the group’s interactions. However, the limitations of focus group discussions are that sometimes people are intimidated by each other and become more conscious and careful in their answers. Because of their small sample size, focus groups are usually used for exploratory research, rather than descriptive or explanatory research.
Observations: This is a systematic approach to collect data about individuals during their everyday life. Depending on the goals of the research, the level of the interaction of the researcher with the subjects of their observation might vary. If the researcher is not interested in interacting with their subject and is only focused on systematic observation of their everyday lives, they can be an outside observer. However, if the researcher wants to interact with their subjects and wants to experience their everyday life with them, they will need to conduct a participant observation. The latter is time consuming, but it builds trust between the researcher and participants.
Content Analysis: This allows to systematically study documents and communication artifacts, which can be texts of various formats, pictures, audio, or video. Although content analysis is usually considered a qualitative research method, it can sometimes be used to convert qualitative data to quantitative data through a systematic evaluation of texts or graphics. 3.3 Interview Guides[4]
The main objective of interviews (whether personal interviews or focus groups) is to allow individuals to share their stories and their experiences. This is very different from the survey questionnaire where individuals are requested to answer a set of pre-determined questions with pre-determined answers (close-ended questions in most cases, or very short answers). Therefore, interviews should be designed to allow flexibility and to open room for new ideas and concepts to emerge, even if the researcher had not thought about it. Thus, interview questions are open-ended and the interviewee should be allowed enough time to reflect, reply, and elaborate.
There are two main types of interview guides: (1) the structured interview guide, and (2) the semi-structured interview guide. In the first type of interview guide, questions are set in a particular order with a specific wording used. The researcher gives space for answers and elaboration, but still follows the interview guide closely. On the other hand, semi-structured interviews are less rigid and usually take the form of a discussion or a conversation. In this type of interview, the interview guide acts as a prompt that the interviewer only uses to remember the topics to be addressed, and make sure all questions are covered. In both types of interview guides, the researcher usually probes the participant’s answers in order to get more details about a certain topic or to direct the conversation.
Tips for developing an Interview Guide
Based on your main research topic and your specific research question, write down the main areas, or sub-questions, to be covered in your interview.Develop a few questions for each area that inquire about the participants’ own experiences and link them to the topic you want to study. Think about the logical flow of the interview. What topics should come first? What can follow more or less “naturally”? This can be adjusted after several interviews. Begin the interview with a “warm-up” question—something that the respondent can answer easily and at some length. It does not have to pertain directly to what you are trying to find out (although it might), but this initial rapport-building will put you more at ease with one another and help make the rest of the interview flow more smoothly. Make sure to use clear and neutral language in your questions. Keep your questions short and simple, as long questions can be confusing. Do not ask more than one question at a time. The best questions are those which elicit the longest answers from the respondent. Do not ask questions that can be answered with one word. Do not ask questions that require your respondents to do your analysis for you. For example, do not ask your respondent to try to explain to you why your other respondent gave a different answer to the same question. Likewise, do not ask for hearsay or opinions on behalf of the group they are a part of “What do people around here think of x?”It is preferable to ask “how” questions instead of “why” questions in order to get insights about processes rather than normative claims and explanations. Difficult or potentially embarrassing questions should be asked towards the end of the interview, when trust has been established. However, interviewees maintain the right not to answer if they feel uncomfortable. As such, you should pay close attention to body language and facial expression. The last question should provide some closure for the interview, and leave the respondent feeling empowered, listened to, and/or glad that they talked to you. Always thank the interviewee for their time and their contribution to your research at the end, and ask if they have any questions for you. Also, make sure to give them contact information in case they have any questions regarding their contribution later on. This reflects your respect for them and can encourage them to help with future studies or follow ups.
Tips: Guidelines for the Interviewer:
Be empathic, warm, attentive, humorous (where appropriate), and considerate with your participants.Avoid showing any judgmental attitudes, shock or discomfort when listening to your interviewee.Never answer a question for the respondent. Be completely engaged with the respondent, while at the same time keeping track of the questions one needs to ask. You can use active listening techniques, such as repeating what was said, asking for more information, mentioning that something is interesting. Do not be afraid of silence; you can use it to prompt the respondent to reflect and amplify an answer.Try not to worry too much about time—relax into the interview, especially if the respondent is comfortable taking time and talking. 3.4 Conducting the Interview
Before going to the interview, the researcher should be clear about the possible biases that can arise in the interview, and carefully consider ways to limit them, by notably choosing wisely how to present themself. This includes thinking of how to dress (not wearing religious signs if possible, respecting local culturally accepted dress code, etc.), how to introduce and how to carry oneself. Remember that all interviews start with the interviewee interviewing the interviewer. In other words, the participants usually want to start by knowing more about the research, but also the researcher. Any information about the identity of the researcher that might interfere or alter the answers of the interviewee needs to be avoided. If it is impossible to avoid or hide one’s identity (such as gender, race/ethnicity, religion, accent, etc.), the researcher needs to acknowledge this possible bias as a limitation of the research method.
Once the interviewer has thought of all the biases and of possible ways to deal with them, set an appointment with the interviewee at a place and time of their choice (of course, safety measures should always be considered). On the day of the interview, make sure to arrive on time and to introduce yourself. Make sure to explain the research and its aims, and to inform the participants about the expected duration of the interview, anonymity and confidentiality, and the right not to answer or withdraw from the research. Make sure to also ask for consent if you want to record or videotape.
Once consent is granted, start the interview with a few ‘warm-up’ questions you prepared in your interview guide, as this will help set a relaxed tone for the interview and build trust between the researcher and the respondent. The questions should follow a certain logical order, but the researcher should have the flexibility to let the respondent elaborate on a point even if it has been brought up ahead of time (not in the order of the questions in the guide). The interviewer should refrain from expressing their own opinion or giving leads into answers; however, they must probe, unpack any interesting information said passingly, and encourage the respondent to elaborate. Finally, the interview should always end with thanking the respondent for their time and cooperation.
3.5 Analysing Qualitative Data
At the end of the data gathering stage in qualitative research, the researcher finds themself with an important amount of data and information that seem difficult to organise and process. But do not get discouraged, once some order is put into the data, analysis will become easier. Remember that the aim of data analysis in qualitative research is to synthesise and depict trends and patterns. This is usually done through 6 steps:
Transcribing: Having the interviews written facilitates the analysis. If the interview was recorded, the researcher can decide to only transcribe the parts that are relevant to the research. However, if the research requires full transcription (especially for textual /linguistic analysis), the researcher needs to transcribe all the details (including pauses, laughing, etc.). NVIVO and other software programmes can help with transcription and data processing.
Ordering and Cleaning the Data: Since the researcher would have already collected a huge amount of data (including interview data, archival data, field notes, secondary data, etc.), it is important to start excluding the sources or the details that are not directly linked to the research topic. It is also important to organise the data in a clear way that would allow retrieving it easily. Some researchers prefer to organise the data by source type (newspaper archives, interviews, field notes, etc.); while others prefer to organise the data by themes. Here again, softwares can be helpful for organising and cleaning the data.
Coding: After having read the data a first time, the researcher can start coming up with codes (or sub-themes/sub-titles) that can help them depict the trends and support their analysis with easily retrievable empirical data. The coding process happens over several rounds of reading and re-reading the text to make sure that all the information has been extracted. The researcher usually writes notes and makes some initial analyses while coding the data.
Depicting Patterns and Trends: This step is very similar to the coding step, but it takes the analysis to a more conceptual level, where ‘codes’, ‘subtitles’, ‘subthemes’, and the researcher’s notes and questions are all synthesised into categories, then developed into broader concepts that depict trends and patterns in a comparative manner.
Cross-checking: At this stage, the researcher can cross-check their analysis by comparing different sources of data and by comparing their work with previous work in the field. Sources used in cross-checking should be chosen randomly to ensure that data validation is accurate.
Linking Analysis to Theory: Finally, the researcher has to use their analysis (after comparing and cross-checking) in order to theorise. At this stage, they will have to go back to their literature review and place their contribution within the wider literature. For example, a researcher examining migration and refugee policies in Lebanon can show how their findings explain the reality of the situation in relation to what’s been written about the topic before.
Tips: Avoid these common mistakes in qualitative data analysis
Using percentages: Given the small size of the samples targeted in qualitative research, it can be misleading to use percentages or numerical figures in the analysis.Generalisation: Given that the samples targeted in qualitative research are not only small but are also non-random and unrepresentative, it is misleading use qualitative data to generalise about a population.Not mentioning the limitations: All research methods, whether qualitative or quantitative, have limitations. It is crucial that the researcher acknowledges those limitations and explain the efforts made to mitigate them. These limitations vary depending on the data collection method used, and the type of research design in general.
4.1 Characteristics of Quantitative Research
Quantitative methods usually serve to study the relationship between variables using numbers and statistical analyses. This research method can either be used to describe certain phenomena and trends in society (descriptive statistics), or to explain these trends (inferential statistics). The collected data can be turned into numerical results that can then be displayed visually, through graphs, charts, and tables. We can highlight three main characteristics of quantitative methods:
Data collection and data analysis is relatively easier and faster than qualitative methodsResults can be generalised if the sample is random and large enough, but they lack the depth of qualitative methods (in terms of studying mechanisms, dynamics, and processes). Results are often perceived as more robust and credible – although this is not always true – especially to practitioners and advocacy groups who see quantitative indicators as helpful to lobby the implementation of certain policies.4.2 Data Collection Methods
There are three main ways to collect quantifiable data:
Surveys: This is the most widespread data collection method for quantitative research. It relies on asking a set of questions to a large sample and coding the answers in a numerical way. Examples of surveys can include election polling surveys, censuses, needs assessment surveys, etc. (For more information on how to write a survey questionnaire please refer to Section 4). Experiments: A method that is commonly used in medical and psychology research. It relies on controlling the variables through giving participants specific treatments (stimuli) and measuring how they react. Examples of experimental research include pharmaceutical testing research, behavioral research, etc.Observational Study: This method simply entails counting observations and quantifying them. Examples include counting the number of protesters, prayers in a mosque, students in a school, etc.4.3 Understanding Research Variables
There are two main types of variables that can be used in statistical analyses (Figure 5):
Quantitative / Numerical Variable: The measurement scale has a numerical value. For example: age, income, height, weight, price, number of protesters, number of refugees, etc.Quantitative variables are also called “interval variables” since they measure the interval or numerical distance between each pair of measurements. For example, the interval between a salary of 3,000$ and 4,000$ is 1,000$. This interval can be: Discrete Variable: when the possible values of the variable form a set of separate numbers, such as 0; 1; 2; 3. For example, the number of children is a discrete variable.Continuous Variable: when the possible values of the variable can take an infinite continuum of possible real numbers, such as 0.176; 3.14171618. For example, one’s height is a continuous variable, currency exchange rate is continuous, etc
.Figure 6. Types of Variables
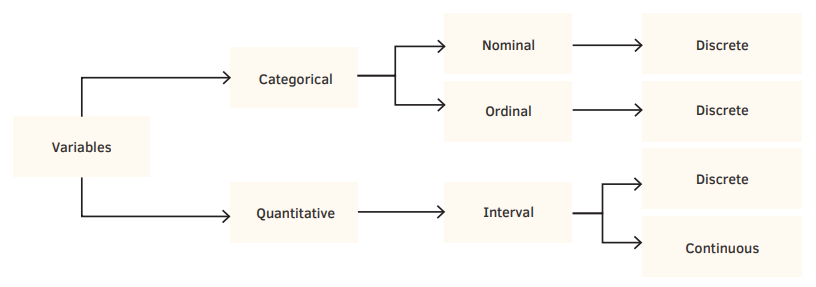
Qualitative / Categorical Variable: The measurement scale is a set of categories. For example: sex (male/female), nationality (Lebanese, Syrian, Iraqi, etc.), or marital status (married, divorced, separated, widowed, other). Categorical variables can be either nominal or ordinal:
Nominal Variable: categories are unordered and the scale has no “high” or “low”. For example, gender is a nominal variable since there is no necessary order for the answer (man/ woman/other or woman/man/other).
Ordinal Variable: categories are ordered according to a hierarchy. For example, opinion surveys are designed using questions that have a Likert scale answer (Strongly Agree/ Agree/ Disagree/ Strongly Disagree). In the analysis of such surveys, answers are coded (assigned numerical values), so strongly agree can be 5, agree can be 4, disagree can be 3 and so forth.
4.4 Designing a Survey[5]
Below are some general rules for survey design:
Don’t Reinvent the Wheel: Pre-Test Your Survey: Think About the Mode of Your Survey Keep Your Questionnaire Short: Respondents are less likely to answer a long questionnaire than a short one, and often pay less attention to questionnaires which seem long, monotonous, or boring.
Keep Question Order in Mind: Survey responses can be impacted by previous questions, with things mentioned impacting following answers. So start the questionnaire with an introduction. If a respondent reads the survey, provide a title for each section. If an interviewer reads a survey, write smooth verbal transitions. It is usually best to start a survey with general questions that will be easy for a respondent to answer. It is usually best to ask any sensitive questions, including demographics (especially income), near the end of the survey.
Filtering and Branching
Tips for administering the survey:
If you are enlisting an interviewer, give them clear instructions, and write out any specific instructions. If the respondent is reading and filling the survey, have clear instructions on the page. If the respondent does not read the survey, be sure to keep the answer options concise and have the interviewer read the possible responses as part of the question. Always allow responses such as “I don’t know” or “Other, please specify”, even when the interviewee is reading the questions.If you are asking a series of similar questions, randomising the order respondents hear them can improve your data, otherwise their answers might be similar.
Open-Ended versus Closed Ended Questions:
Open ended questions allow respondents to answer questions in their own terms. However, they are time consuming and require a lot of work to analyse
Closed ended questions are questions where the respondent is asked to select one of a limited number of provided, pre-set responses. When well designed, they ensure that respondents interpret questions the same way.
Keep in mind that respondents are more likely to skip an open-ended than closed-ended question. You may, however, have a comments section or a question with an open-ended answer if you want to leave your respondents some room for an input that is not pre-determined. This can later compliment your analysis. [6]
Tips for Rating Scales for Attitude Questions:
Usually between five and seven points is best Generally, providing a middle category provides better data Points on the scale should be labeled with clear, unambiguous wordsThe order that response categories are presented to a respondent can also influence their answer choices.
Tips on Writing Survey Questions
Avoid technical terms and jargon, and use words that are easily understood by anyone taking the survey. Avoid vague or imprecise terms. For example, it is not clear what you get when you ask “How important is it that a candidate shares your values?” You might get a more consistent answer if you asked: “How important is it that a candidate shares your religious values?” Avoid complex and long sentences as they can be confusing. Scales that ask respondents to make complex calculations can also cause similar issues. Provide reference frames to make sure all respondents are answering questions about the same time and place. For example, do not ask: “How good is the economy these days” and assume everyone is talking about the same economy. A better way might be to ask: “How good is the economy in your community currently?” Make sure scales are ordinal: If you are using a rating scale, each point should be clearly higher or lower than the other for all people. For example, do not ask “How many jobs are available in your town: Many, a lot, some, or a few.” It is not clear to everyone that “a lot” is less than “many.” A better scale might be: “A lot, some, only a few, or none at all.” Avoid double-barreled questions: Questions should measure one thing, double-barreled questions try to measure two or more. For example, the question “do you think the government should increase taxes and provide free healthcare for all?” might be confusing for respondents who think the government should only do one of these things. Options for answers should anticipate all possibilities. If a respondent could have more than one response to a question, it is best to allow for multiple choices. If the categories you provide don’t anticipate all possible choices, it is often a good idea to include an “Other, please specify” category. If you want a single answer, make sure your answer choices are unique and include all possible responses. If you are measuring something that falls on a continuum, word your categories as a range.Avoid questions using emotional or evocative language. Do not lead your respondent by adding descriptions or adjectives that might affect their answer. For example, “Do you believe that the corrupt Lebanese politicians will be able to reform the electoral law?”. In this case, it is better to delete the word “corrupt” and leave it for the respondent to judge. Sometimes the associations can be more subtle. For example, “Do you support or oppose the General Confederation of Workers’ call for strike on Monday?” Some people might support or oppose this because it is sponsored by the General Confederation of Workers, not because of their opinions toward the strike.4.5 Quantitative Data Analysis
Quantitative data analysis falls under two categories: (1) descriptive statistics, and (2) inferential statistics. While descriptive statistics summarise what is going on in a sample or a population; inferential statistics, by contrast, allow the researcher to make predictions about the population based on the findings in the sample. In other words, inferential statistics generalise findings from the sample to a larger population.
4.5.1 Descriptive Statistics
This type of statistics aims at describing certain trends or phenomena in a dataset (or a sample) through a numerical figure such as a relative frequency (portions or percentages), an average, a range, etc. The results of descriptive statistics are usually portrayed in a graphical form through pie charts, histograms, bar charts, etc.
Descriptive statistics can be used to either measure central tendency or to measure variance in the data.
Measures of Central Tendency
Mean: The most common way of measuring central tendency but not always the most accurate one. The mean is simply the sum of the measurements divided by the number of observations. The mean is appropriate only for quantitative variables since it does not make sense to compute the mean for a categorical variable (example: gender or religion). Moreover, the mean is highly influenced by outliers, or extreme observations that skew the distribution. For example, if I want to measure the average income in a sample and the sample includes a few billionaires, the mean is going to be skewed upwards. It will not represent a good estimate of the average income of most people in my sample. In this case, the median is a better measurement of central tendency. Median: The middle value once we have placed our data in an increasing order. Like the mean, the median is appropriate for quantitative variables. Since it requires ordered observations, the median can also be valid for ordinal scale data. It is, however, not appropriate for nominal scale data. An important property of the median is that it is not affected by outliers. Example: Imagine we ranked all observations, the median is simply the observation in the middle (½ of observations above and ½ below).
In ascending order the salaries are:13,000; 19,000; 22,000; 31,000; 75,000.
Median = $22,000.
When the sample size is even (not odd), two middle observations occur, and the median is the midpoint between the two.
Example: Student grades are the following: 59; 64; 70; 72; 73; 90
The median is (70 + 72) / 2 = 71
Mode: The value that occurs most frequently. It is appropriate for all types of data (quantitative or categorical), but it is most used for discrete variables, such as categorical data. The mode can be used for example to determine the most common age at marriage for example. Similarly, it is used by retail shops when they decide on the sizes to buy most, which are the most frequently demanded sizes, so they will have a bigger stock of these.
Measures of Variance
Graphical representationsCategorical Data: Tables, Bar Graphs & Pie ChartsQuantitative Data: Tables, Histograms & Stem-and-Leaf Plots
A common mistake for example is to use a histogram instead of a bar chart for categorical variables such as gender. Similarly, pie charts are better used to represent categorical data with a small number of values instead of representing quantitative data.
4.5.2 Inferential Statistics
As explained above, inferential statistics aim at generalising and predicting patterns about a population based on a sample. It is usually impossible to examine each member of the population individually. So scientists choose a representative subset of the population, called a statistical sample, and from this analysis, they are able to say something about the population from which the sample came.
Usually, inferential statistics are used to judge certain statistical claims (or hypothesis). Therefore, the logic of inferential statistics is based on hypothesis testing.
●Hypothesis Testing
A hypothesis should be clear and precise (measurable), should be falsifiable (can be disproved; non-falsifiable claims are outside the realm of scientific testing), and it should test the relationship between two variables (no more): a dependent variable (the variable we want to explain or predict), and an independent variable (the explanatory variable).
A hypothesis is normally generated from a combination of theory, past empirical work, and common sense or observation; and it is tested in light of new empirical data.
Example of a hypothesis:
Women tend to score better than men in official baccalaureate exams in Lebanon.
This is a precise, testable, clear and falsifiable statement that studies the relationship between two variables: gender (independent variable) and academic achievement in baccalaureate exams (dependent variable).
●Inferential Statistics Techniques
Inferential statistics techniques that are used to examine the relationships between variables and include regression analyses, ANOVA tests, correlation tests, chi-square tests, t-tests, etc. depending on the type of variables we are testing. These statistical tests can be produced easily through the aid of statistical packages such as SPSS or STATA. Based on statistical significance levels of the values the aforementioned tests produce, the researcher can tell whether the results of the analysis of the sample are representative of the population as a whole.
●Correlation vs. Causation
While most researchers would like to find a causation between variables, it remains very difficult
to establish causation, especially in social scientific research. Therefore, we need to distinguish
between correlation (that is when two variables relate to each other), and causation (when one variable is the direct cause of the other).
In order to be able to establish causation, three main criteria need to be found:
1.Association: the basis of any causation is first correlation. The existence of a regular relationship between two variables is crucial to establishing causation.
2.Non-Spurious Relationship: the researcher needs to make sure that the relationship between the two variables is not spurious, i.e. is not due to coincidence, nor caused by a third “confounding” variable that is unaccounted for.
3.Time Order: The cause has to precede the effect in order to establish causation. Although this might sound like a trivial condition, it is a common mistake to talk about causation even when the effect precedes the cause.
Tip: Always remind yourself the phrase “correlation does not imply causation” which is commonly shared by social scientists and statisticians alike. [7]
Section 5. Writing Up and Publishing
The writing up of the research is one of the most crucial steps since it is the main output of the research process that will be read, evaluated, and used by others. Therefore, it is important to dedicate ample time to this phase to give justice to your research by making sure it is well-written.
Writing-up the Research: Choosing the Format and the Structure
Writing up the research can take different formats depending on how the researcher(s) want(s) to present the work. If the research is for an academic publication, it will take the format of an academic research paper. If it is aimed at policy makers, it will take the shape of a policy report, with possibly recommendations for action and intervention. Finally, if it is aimed at a wider audience (which will be the case for most civil society publications), it will take the format of a research report.
There are only a few differences in the structure and format of these different research output types. Figure 7 outlines the main differences between these formats, and can help you decide which to adopt.
Figure 7. Research Output Format
|
|
Research Report |
Policy Paper |
Academic Research Paper |
|
|
|
Title Page |
√ |
√ |
√ |
|
|
Table of Content |
√ |
√ |
|
|
Either / OR |
Abstract |
|
|
√ |
|
Executive Summary |
√ |
√ |
|
|
|
Could be combined |
Introduction |
√ |
√ |
√ |
|
Context |
√ |
√ |
√ |
|
|
|
Literature Review |
√ |
√ |
√ |
|
|
Methodology |
√ |
√ |
√ |
|
Could be combined |
Findings / Results |
√ |
√ |
√ |
|
Analysis |
√ |
√ |
√ |
|
|
|
Policy Recommendation |
|
√ |
|
|
|
Conclusion |
√ |
√ |
√ |
|
|
Appendices |
√ |
√ |
√ |
|
|
Bibliography / References |
√ |
√ |
√ |
We outline below the main sections that should be included in any research report/paper.
Title Page: The first page of the research should include the title. The title has to be carefully chosen, keeping in mind that it should be precise, clear and concise, referring to the main topic of research and attractive (in order to increase access to and readership of the study).
Table of Content: This page includes a list of all the sections and sub-sections of the research, along with the corresponding pages. It can be automatically generated on certain programmes like Microsoft Word or Google Docs[6].
The Abstract / Executive Summary: An abstract is usually shorter (250 to 500 words) than an executive summary (1 to 5 pages). Both the abstract and the executive summary should answer the below:What: What is the research topic/ problem/ question?Why: Why is it important?When and Where: What is the time period and the area the research is covering?Who: Who is the sample studied?How: How has the study answered the research question? Or, what are the research methods?Results: What are the findings / results of the study?
The Introduction / Context: The introduction and the context can either be combined or separated. If, for example, it is important to detail the historical context, then it is recommended that the context section be separate and elaborate.
Generally speaking, the introduction should cover the topic of the research, the relevance/importance of the research, the main research problem / question(s), the hypotheses to be tested, and the outline of the rest of the paper.
Literature Review: This section lays out the main theoretical debates in the field and surveys the most recent and relevant studies in order to engage with them. If the research is written in the format of a policy paper or a report, the literature review is usually shorter than in academic papers. However, this step remains a crucial one since it shows how the research builds on previous studies in order to advance new knowledge and to test older findings. This section is not simply a summary of previous studies, but rather an active engagement with / or evaluation of previous research in the field.
Methodology: This section explains the methods used by the researcher(s) in order to gather data and, thus, answer the research question. The methodology section should include a justification for the choice of methods, the sampling techniques used, the data collection and data analysis procedures. In addition, the methodology section should always include a paragraph about the limitations of the methods used (possible biases, etc.).
Findings and Results: This section is usually the longest in the research paper since it reports the data collected and analyses it in details in order to test the hypotheses and to relate the findings to the literature review (or to put it in a dialogue with previous studies). It usually consists of several sections and sub-sections that are divided by themes (or codes, or hypotheses). Results and analysis should be written in an ‘objective’ way, whereby claims are substantiated with data. No generalisations are to be made unless they are fully supported by the sample representativeness.
Recommendations: Recommendations are based on research findings and propose solutions to specific problems and issues addressed in the research. This step is not important in academic studies, but it is important for policy papers and for research reports produced by civil society actors.. Conclusion: The conclusion usually wraps up the research by restating the research problem and providing an answer to it. It summarises the research methods and explains the main findings and analyses. It usually ends with an opening on a new topic or a recommendation for future research.
Appendices: In many studies, the researcher finds it important to add appendices at the end of the study in order to provide the reader with more details that could not be included in the main parts of the research paper for considerations of length. For example, the appendices could include the survey questionnaire that was distributed.
Bibliography: Finally, the researcher should include all the references used in the research in his bibliography following alphabetic order. There are several referencing styles available today (APA, MLA, etc.) and there are softwares that can help the researchers manage their references and citations easily.
Conclusion
Evidence-based research is increasingly becoming central to the work of civil society organisations. This is especially relevant today given the increased reliance on CSOs to deliver services, address social problems, and advocate for rights. Thus, knowledge of research methods and the integration of research-based assessments and planning is core to guaranteeing efficiency and effectiveness in the work of CSOs.
Calls to bridge between the work of researchers and that of civil society organisations have gained important grounds. They not only encompass relying on competent researchers in designing their programmes and interventions, but also, and more importantly, a call for CSOs to develop their own internal research skills and integrate research as an intrinsic part of their work. As such, this guidebook aims to introduce civil society practitioners to the basics of research methods, and to invite them to “think like researchers” while developing their programmes and interventions, in view of enhancing the relevance and effectiveness of civil society work in Lebanon.
[1] As opposed to formal sciences, for example logic and mathematical sciences, that do not research phenomena in reality, but rather focus on the rational level to come up with formulas or theories; empirical research in social sciences is grounded in evidence, data and experiences.
[2] Note that the definition of primary and secondary data may vary. For example, newspaper articles can be considered as primary sources if they provide accounts of events as they happen.
[3] The only type of research that includes everyone in a population is the census, and it is usually conducted by governments since it requires important financial and human resources.
[4] Information provided in this section has been taken (and adapted) from the Harvard’s Sociology Department Handout: “Strategies for Qualitative Interviews”. Available at: http://sociology.fas.harvard.edu/files/sociology/files/interview_strategies.pdf
[5] Information provided in this section has been taken (and adapted) from the Harvard University Program on Survey Research. Available at:
https://psr.iq.harvard.edu/files/psr/files/PSRQuestionnaireTipSheet_0.pdf
[6] Refer to Lebanon Support’s practical guide for ICT for Development for more.


